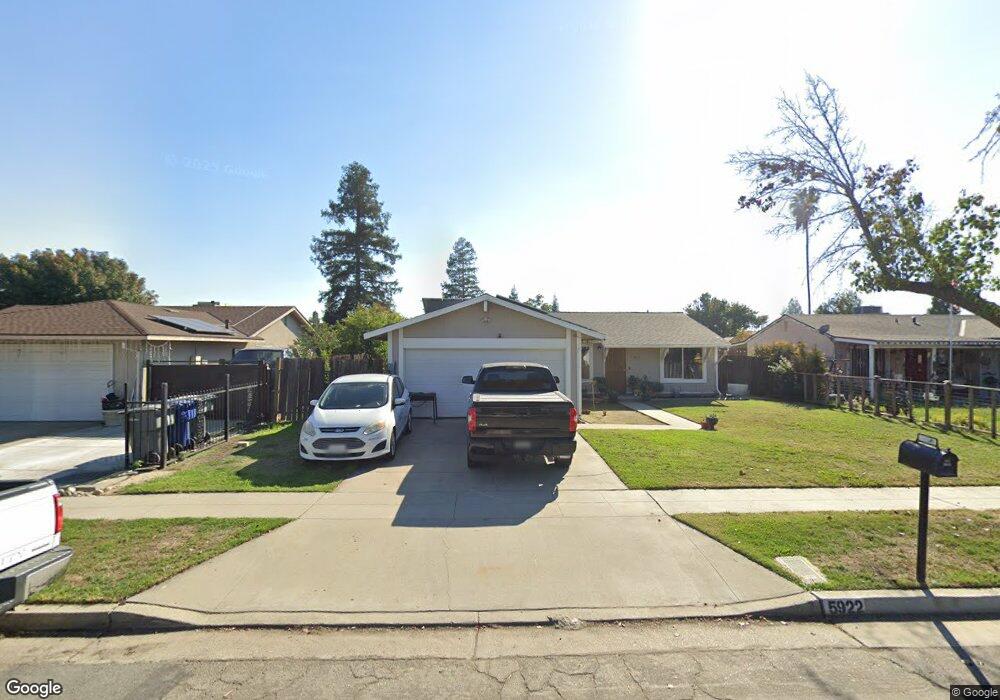
5922 E Ramona Ave Fresno, CA 93727
McLane NeighborhoodEstimated Value: $314,000 - $370,774
3
Beds
1
Bath
1,100
Sq Ft
$309/Sq Ft
Est. Value
About This Home
This home is located at 5922 E Ramona Ave, Fresno, CA 93727 and is currently estimated at $339,944, approximately $309 per square foot. 5922 E Ramona Ave is a home located in Fresno County with nearby schools including Tomahawk School, Miramonte Elementary School, and Reyburn Intermediate School.
Ownership History
Date
Name
Owned For
Owner Type
Purchase Details
Closed on
Jan 12, 2021
Sold by
Antoniou Antonis
Bought by
Antoniou Antonis and Antoniou Marie N
Current Estimated Value
Purchase Details
Closed on
Mar 4, 2013
Sold by
Antoniou Antonis
Bought by
Antoniou Antonis and Antoniou Christakis
Purchase Details
Closed on
Jun 22, 2010
Sold by
Secretary Of Veterans Affairs
Bought by
Antoniou Antonis
Purchase Details
Closed on
Jun 21, 2010
Sold by
Antoniou Marie Nicholas
Bought by
Antoniou Antonis
Purchase Details
Closed on
Oct 5, 2009
Sold by
Gmac Mortgage Llc
Bought by
The Secretary Of Veterans Affairs
Purchase Details
Closed on
Sep 11, 2009
Sold by
Lynch Michael E
Bought by
Gmac Mortgage Llc
Purchase Details
Closed on
Jul 27, 2000
Sold by
Butler Donna R
Bought by
Lynch Michael E
Home Financials for this Owner
Home Financials are based on the most recent Mortgage that was taken out on this home.
Original Mortgage
$79,050
Interest Rate
8.15%
Mortgage Type
VA
Create a Home Valuation Report for This Property
The Home Valuation Report is an in-depth analysis detailing your home's value as well as a comparison with similar homes in the area
Home Values in the Area
Average Home Value in this Area
Purchase History
| Date | Buyer | Sale Price | Title Company |
|---|---|---|---|
| Antoniou Antonis | -- | None Available | |
| Antoniou Antonis | -- | None Available | |
| Antoniou Antonis | $74,000 | Stc | |
| Antoniou Antonis | -- | None Available | |
| The Secretary Of Veterans Affairs | -- | None Available | |
| Gmac Mortgage Llc | $68,124 | None Available | |
| Lynch Michael E | $77,500 | Fidelity National Title Co |
Source: Public Records
Mortgage History
| Date | Status | Borrower | Loan Amount |
|---|---|---|---|
| Previous Owner | Lynch Michael E | $79,050 |
Source: Public Records
Tax History Compared to Growth
Tax History
| Year | Tax Paid | Tax Assessment Tax Assessment Total Assessment is a certain percentage of the fair market value that is determined by local assessors to be the total taxable value of land and additions on the property. | Land | Improvement |
|---|---|---|---|---|
| 2025 | $2,059 | $168,803 | $44,731 | $124,072 |
| 2023 | $1,982 | $162,250 | $42,995 | $119,255 |
| 2022 | $1,955 | $159,069 | $42,152 | $116,917 |
| 2021 | $1,370 | $111,909 | $22,653 | $89,256 |
| 2020 | $1,365 | $110,762 | $22,421 | $88,341 |
| 2019 | $1,338 | $108,591 | $21,982 | $86,609 |
| 2018 | $1,310 | $106,462 | $21,551 | $84,911 |
| 2017 | $1,287 | $104,376 | $21,129 | $83,247 |
| 2016 | $1,245 | $102,330 | $20,715 | $81,615 |
| 2015 | $1,226 | $100,794 | $20,404 | $80,390 |
| 2014 | $1,204 | $98,821 | $20,005 | $78,816 |
Source: Public Records
Map
Nearby Homes
- 5934 E Dakota Ave
- 5936 E Lansing Way
- 3550 N Duke Ave Unit 37
- 3550 N Duke Ave Unit 10
- 3550 N Duke Ave Unit 12
- 3556 N Duke Ave Unit 165
- 3322 N Ezie Ave
- 6157 E Garland Ave
- 5965 E Shields Ave Unit 178
- 6402 E Millie Dr
- 6008 E Sussex Way
- 3734 Manila Ave
- 6083 E Andrews Ave
- 6165 E Farrin Ave
- 3624 Eddy Ave
- 3605 Phillip Ave
- 6406 E Giavanna Ave
- 1916 Ashlan Ave
- 2870 N Sophie Dr
- 5739 E Hampton Way
- 5916 E Ramona Ave
- 5926 E Ramona Ave
- 5923 E Robinson Ave
- 5919 E Robinson Ave
- 5912 E Ramona Ave
- 5930 E Ramona Ave
- 5927 E Robinson Ave
- 5913 E Robinson Ave
- 5921 E Ramona Ave
- 5925 E Ramona Ave
- 5931 E Robinson Ave
- 5915 E Ramona Ave
- 5936 E Ramona Ave
- 5910 E Ramona Ave
- 5909 E Robinson Ave
- 5929 E Ramona Ave
- 5911 E Ramona Ave
- 5937 E Robinson Ave
- 5933 E Ramona Ave
- 5905 E Robinson Ave