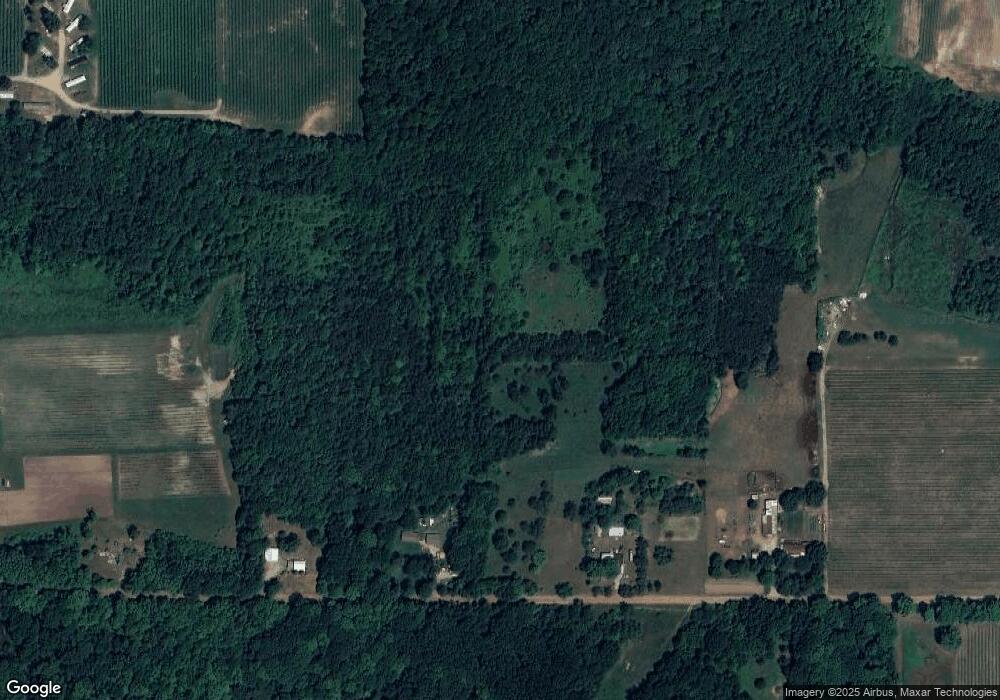
5925 106th Ave Pullman, MI 49450
Estimated Value: $207,322 - $325,000
3
Beds
1
Bath
1,148
Sq Ft
$218/Sq Ft
Est. Value
About This Home
This home is located at 5925 106th Ave, Pullman, MI 49450 and is currently estimated at $250,831, approximately $218 per square foot. 5925 106th Ave is a home located in Allegan County with nearby schools including Bloomingdale High School.
Ownership History
Date
Name
Owned For
Owner Type
Purchase Details
Closed on
Dec 21, 2009
Sold by
Larson Levern R and Larson Ilene
Bought by
Looman Terry A and Looman Nancy L
Current Estimated Value
Home Financials for this Owner
Home Financials are based on the most recent Mortgage that was taken out on this home.
Original Mortgage
$69,387
Interest Rate
4.9%
Mortgage Type
New Conventional
Purchase Details
Closed on
Nov 21, 2008
Sold by
Larson Levern R and Larson Ilene
Bought by
Looman Terry A and Looman Nancy L
Create a Home Valuation Report for This Property
The Home Valuation Report is an in-depth analysis detailing your home's value as well as a comparison with similar homes in the area
Purchase History
| Date | Buyer | Sale Price | Title Company |
|---|---|---|---|
| Looman Terry A | $85,000 | Chicago Title | |
| Looman Terry A | -- | Devon Title Agency |
Source: Public Records
Mortgage History
| Date | Status | Borrower | Loan Amount |
|---|---|---|---|
| Closed | Looman Terry A | $69,387 |
Source: Public Records
Tax History
| Year | Tax Paid | Tax Assessment Tax Assessment Total Assessment is a certain percentage of the fair market value that is determined by local assessors to be the total taxable value of land and additions on the property. | Land | Improvement |
|---|---|---|---|---|
| 2025 | $1,404 | $93,500 | $35,100 | $58,400 |
| 2024 | $1,066 | $93,600 | $29,500 | $64,100 |
| 2023 | $1,066 | $68,900 | $16,900 | $52,000 |
| 2022 | $1,066 | $59,200 | $15,300 | $43,900 |
| 2020 | $1,112 | $40,600 | $14,000 | $26,600 |
| 2019 | $1,057 | $43,900 | $14,000 | $29,900 |
| 2018 | $0 | $46,700 | $13,300 | $33,400 |
| 2017 | $0 | $36,800 | $12,700 | $24,100 |
| 2016 | $0 | $33,200 | $12,100 | $21,100 |
| 2015 | -- | $33,200 | $12,100 | $21,100 |
| 2014 | -- | $33,800 | $12,600 | $21,200 |
| 2013 | -- | $36,000 | $11,600 | $24,400 |
Source: Public Records
Map
Nearby Homes
Your Personal Tour Guide
Ask me questions while you tour the home.