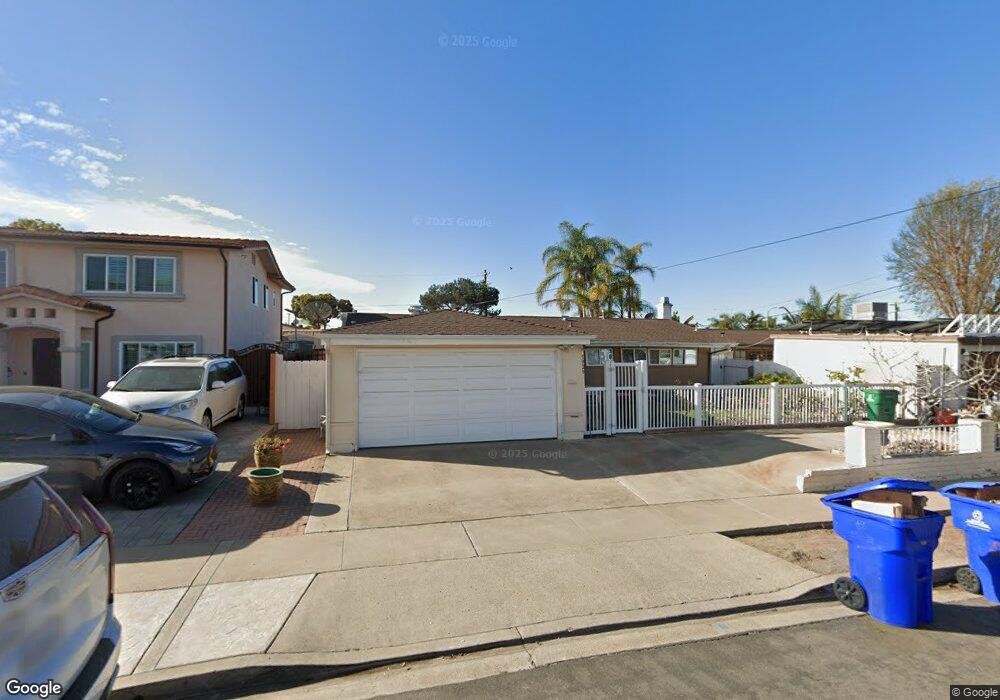
5929 Castleton Dr San Diego, CA 92117
Clairemont Mesa East NeighborhoodEstimated Value: $999,774 - $1,112,000
3
Beds
2
Baths
1,200
Sq Ft
$872/Sq Ft
Est. Value
About This Home
This home is located at 5929 Castleton Dr, San Diego, CA 92117 and is currently estimated at $1,046,194, approximately $871 per square foot. 5929 Castleton Dr is a home located in San Diego County with nearby schools including Lafayette Elementary, Innovation Middle School, and Madison High School.
Ownership History
Date
Name
Owned For
Owner Type
Purchase Details
Closed on
May 4, 2018
Sold by
Paulin Rosemarie
Bought by
Paulin Rosemarie and Client Living Trust
Current Estimated Value
Purchase Details
Closed on
Jun 25, 2010
Sold by
Skytech Mortgage
Bought by
Paulin Rosemarie
Purchase Details
Closed on
May 14, 2010
Sold by
Parko Patrick Lee and Parko Patrick L
Bought by
Skytech Mortgage
Purchase Details
Closed on
Dec 6, 2005
Sold by
Parko Patrick Lee and Park Madelyn Rose
Bought by
Parko Patrick Lee
Home Financials for this Owner
Home Financials are based on the most recent Mortgage that was taken out on this home.
Original Mortgage
$200,000
Interest Rate
6.35%
Mortgage Type
Credit Line Revolving
Purchase Details
Closed on
Oct 24, 2002
Sold by
Parko Madelyn Rose
Bought by
Parko Patrick Lee and Parko Madelyn Rose
Create a Home Valuation Report for This Property
The Home Valuation Report is an in-depth analysis detailing your home's value as well as a comparison with similar homes in the area
Home Values in the Area
Average Home Value in this Area
Purchase History
| Date | Buyer | Sale Price | Title Company |
|---|---|---|---|
| Paulin Rosemarie | -- | None Available | |
| Paulin Rosemarie | $400,000 | Chicago Title Company | |
| Skytech Mortgage | $311,500 | None Available | |
| Parko Patrick Lee | -- | Fidelity National Title Comp | |
| Parko Patrick Lee | -- | -- |
Source: Public Records
Mortgage History
| Date | Status | Borrower | Loan Amount |
|---|---|---|---|
| Previous Owner | Parko Patrick Lee | $200,000 | |
| Previous Owner | Parko Patrick Lee | $250,000 |
Source: Public Records
Tax History
| Year | Tax Paid | Tax Assessment Tax Assessment Total Assessment is a certain percentage of the fair market value that is determined by local assessors to be the total taxable value of land and additions on the property. | Land | Improvement |
|---|---|---|---|---|
| 2025 | $6,165 | $516,308 | $413,057 | $103,251 |
| 2024 | $6,165 | $506,185 | $404,958 | $101,227 |
| 2023 | $6,027 | $496,261 | $397,018 | $99,243 |
| 2022 | $5,866 | $486,532 | $389,234 | $97,298 |
| 2021 | $5,824 | $476,993 | $381,602 | $95,391 |
| 2020 | $5,753 | $472,103 | $377,690 | $94,413 |
| 2019 | $5,649 | $462,847 | $370,285 | $92,562 |
| 2018 | $5,280 | $453,773 | $363,025 | $90,748 |
| 2017 | $5,153 | $444,876 | $355,907 | $88,969 |
| 2016 | $5,069 | $436,154 | $348,929 | $87,225 |
| 2015 | $4,993 | $429,603 | $343,688 | $85,915 |
| 2014 | $4,914 | $421,189 | $336,956 | $84,233 |
Source: Public Records
Map
Nearby Homes
- 5656 Chandler Dr
- 5676 Chateau Dr
- 6666 Beadnell Way Unit 3
- 6750 Beadnell Way Unit 3
- 4610 Lyric Ln
- 6210 Hannon Ct
- 6333 Mount Ada Rd Unit 159
- 6333 Mt Ada Rd Unit 156
- 6333 Mount Ada Rd Unit 179
- 5178 Bowden Ave
- 6907 Bettyhill Dr
- 4775 Jamar Ct
- 4826 Cannington Dr
- 5252 Balboa Arms Dr Unit 171
- 5252 Balboa Arms Dr Unit 205
- 5252 Balboa Arms Dr Unit 120
- 4367 Berwick Dr
- 4055 Mount Albertine Ave
- 5051 Canosa Ave
- 4131 Mount Alifan Place Unit F
- 5941 Castleton Dr
- 5917 Castleton Dr
- 5838 Camber Dr
- 5953 Castleton Dr
- 5854 Camber Dr
- 5822 Camber Dr
- 5905 Castleton Dr
- 5870 Camber Dr
- 5928 Castleton Dr
- 5806 Camber Dr
- 5916 Castleton Dr
- 5940 Castleton Dr
- 5965 Castleton Dr
- 5904 Castleton Dr
- 5952 Castleton Dr
- 5886 Camber Dr
- 5977 Castleton Dr
- 5964 Castleton Dr
- 5841 Camber Dr
- 5865 Castleton Dr
Your Personal Tour Guide
Ask me questions while you tour the home.