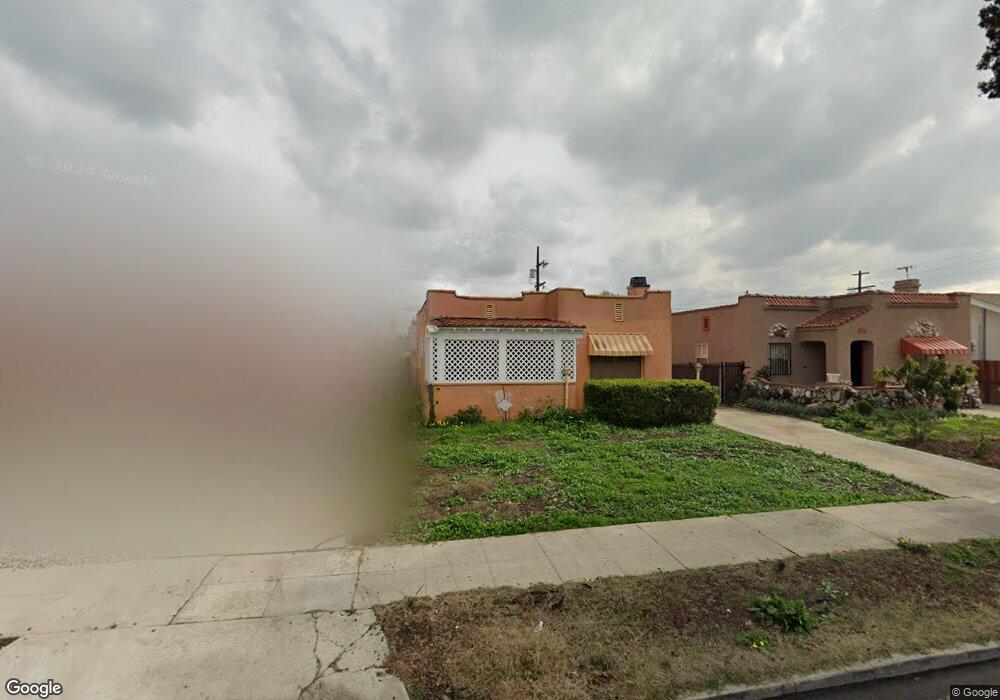
5942 7th Ave Los Angeles, CA 90043
Hyde Park NeighborhoodEstimated Value: $636,000 - $723,000
3
Beds
2
Baths
1,304
Sq Ft
$515/Sq Ft
Est. Value
About This Home
This home is located at 5942 7th Ave, Los Angeles, CA 90043 and is currently estimated at $672,199, approximately $515 per square foot. 5942 7th Ave is a home located in Los Angeles County with nearby schools including Fifty-Ninth Street Elementary School, Horace Mann Ucla Community, and Crenshaw Science, Technology, Engineering, Math And Medicine Magnet.
Ownership History
Date
Name
Owned For
Owner Type
Purchase Details
Closed on
Dec 29, 2013
Sold by
Pace Oris W
Bought by
Kane Hazel Joyce and The Hazel Joyce Kane Trust
Current Estimated Value
Purchase Details
Closed on
Feb 28, 2007
Sold by
Kane Hazel Joyce
Bought by
Pace Oris W and Kane Pace Hazel J
Home Financials for this Owner
Home Financials are based on the most recent Mortgage that was taken out on this home.
Original Mortgage
$350,000
Interest Rate
1%
Mortgage Type
New Conventional
Purchase Details
Closed on
Nov 18, 1997
Sold by
Kane Donald R
Bought by
Kane Hazel Joyce
Create a Home Valuation Report for This Property
The Home Valuation Report is an in-depth analysis detailing your home's value as well as a comparison with similar homes in the area
Home Values in the Area
Average Home Value in this Area
Purchase History
| Date | Buyer | Sale Price | Title Company |
|---|---|---|---|
| Kane Hazel Joyce | -- | None Available | |
| Pace Oris W | -- | Ticor Title Insurance Co | |
| Kane Hazel Joyce | -- | -- |
Source: Public Records
Mortgage History
| Date | Status | Borrower | Loan Amount |
|---|---|---|---|
| Closed | Pace Oris W | $350,000 |
Source: Public Records
Tax History
| Year | Tax Paid | Tax Assessment Tax Assessment Total Assessment is a certain percentage of the fair market value that is determined by local assessors to be the total taxable value of land and additions on the property. | Land | Improvement |
|---|---|---|---|---|
| 2025 | $874 | $57,954 | $23,009 | $34,945 |
| 2024 | $874 | $56,818 | $22,558 | $34,260 |
| 2023 | $864 | $55,705 | $22,116 | $33,589 |
| 2022 | $834 | $54,614 | $21,683 | $32,931 |
| 2021 | $814 | $53,544 | $21,258 | $32,286 |
| 2019 | $793 | $51,958 | $20,629 | $31,329 |
| 2018 | $714 | $50,940 | $20,225 | $30,715 |
| 2016 | $669 | $48,964 | $19,441 | $29,523 |
| 2015 | $661 | $48,229 | $19,149 | $29,080 |
| 2014 | $673 | $47,285 | $18,774 | $28,511 |
Source: Public Records
Map
Nearby Homes
- 5934 Madden Ave
- 5846 Madden Ave
- 6030 Madden Ave
- 5814 7th Ave
- 5922 4th Ave
- 5819 4th Ave Unit 3
- 5830 4th Ave
- 3206 W 59th St
- 6015 10th Ave
- 6121 10th Ave
- 6315 Madden Ave
- 5747 3rd Ave
- 3120 W 63rd St
- 6011 Arlington Ave
- 6333 8th Ave
- 5951 S Van Ness Ave
- 5907 S Van Ness Ave
- 2815 Hyde Park
- 5442 6th Ave
- 2204 W Slauson Ave
Your Personal Tour Guide
Ask me questions while you tour the home.