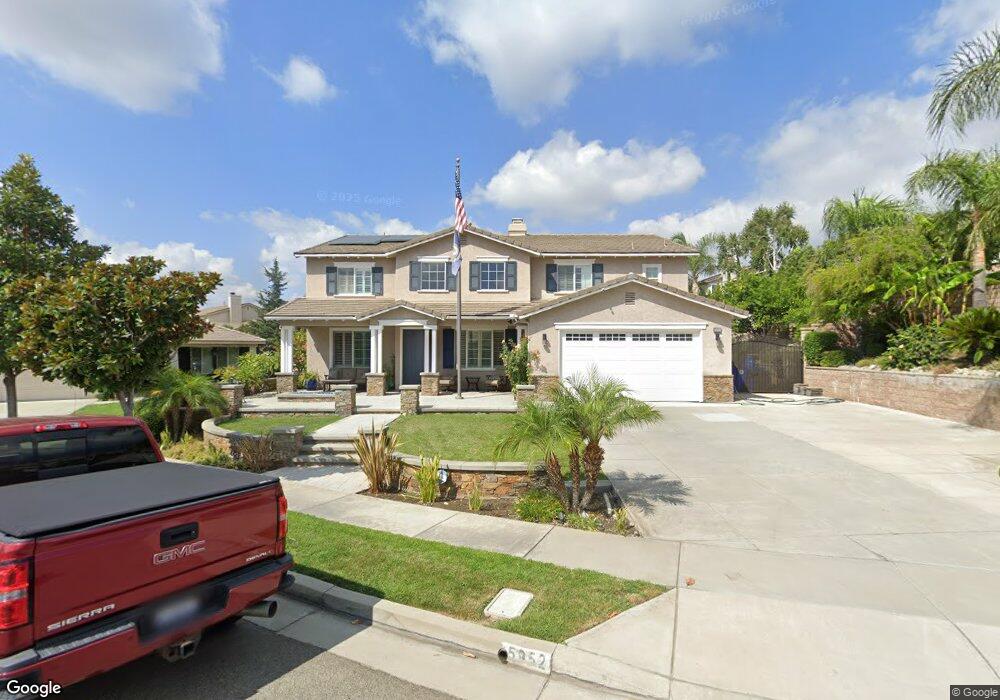
5952 Sandown Place Rancho Cucamonga, CA 91739
Etiwanda NeighborhoodEstimated Value: $1,340,000 - $1,426,000
6
Beds
4
Baths
3,650
Sq Ft
$378/Sq Ft
Est. Value
About This Home
This home is located at 5952 Sandown Place, Rancho Cucamonga, CA 91739 and is currently estimated at $1,380,087, approximately $378 per square foot. 5952 Sandown Place is a home located in San Bernardino County with nearby schools including John L. Golden Elementary, Day Creek Intermediate, and Los Osos High.
Ownership History
Date
Name
Owned For
Owner Type
Purchase Details
Closed on
Oct 18, 2002
Sold by
Standard Pacific Corp
Bought by
Gallardo Roberto and Gallardo Suzanne M R
Current Estimated Value
Home Financials for this Owner
Home Financials are based on the most recent Mortgage that was taken out on this home.
Original Mortgage
$342,250
Outstanding Balance
$141,701
Interest Rate
5.99%
Estimated Equity
$1,238,386
Create a Home Valuation Report for This Property
The Home Valuation Report is an in-depth analysis detailing your home's value as well as a comparison with similar homes in the area
Home Values in the Area
Average Home Value in this Area
Purchase History
| Date | Buyer | Sale Price | Title Company |
|---|---|---|---|
| Gallardo Roberto | $428,000 | Fidelity National Title |
Source: Public Records
Mortgage History
| Date | Status | Borrower | Loan Amount |
|---|---|---|---|
| Open | Gallardo Roberto | $342,250 |
Source: Public Records
Tax History Compared to Growth
Tax History
| Year | Tax Paid | Tax Assessment Tax Assessment Total Assessment is a certain percentage of the fair market value that is determined by local assessors to be the total taxable value of land and additions on the property. | Land | Improvement |
|---|---|---|---|---|
| 2025 | $10,880 | $704,993 | $154,927 | $550,066 |
| 2024 | $10,880 | $691,169 | $151,889 | $539,280 |
| 2023 | $10,623 | $677,617 | $148,911 | $528,706 |
| 2022 | $10,462 | $664,330 | $145,991 | $518,339 |
| 2021 | $10,286 | $651,303 | $143,128 | $508,175 |
| 2020 | $10,142 | $644,624 | $141,660 | $502,964 |
| 2019 | $9,894 | $631,984 | $138,882 | $493,102 |
| 2018 | $10,146 | $619,592 | $136,159 | $483,433 |
| 2017 | $10,354 | $607,443 | $133,489 | $473,954 |
| 2016 | $10,128 | $595,533 | $130,872 | $464,661 |
| 2015 | $10,047 | $586,587 | $128,906 | $457,681 |
| 2014 | $9,820 | $575,097 | $126,381 | $448,716 |
Source: Public Records
Map
Nearby Homes
- 12406 Challendon Dr
- 12430 Split Rein Dr
- 12184 Clydesdale Dr
- 12487 Altura Dr
- 6197 Greenwood Place
- 5675 W Overlook Dr
- 12794 Windstar Dr
- 6331 Thunder Mountain Ave
- 12420 Silk Oak Ct
- 12427 Silk Oak Ct
- 12331 Dove Tree Dr
- 12877 Golden Prairie Dr
- 12253 Knightsbridge Dr
- 12356 Thistle Dr
- 11839 Antler Peak Ct
- 13123 Carriage Trail Ct
- 6264 Shore Pine Ct
- 6525 Etiwanda Ave
- 5450 Stagecoach Ct
- 5231 Flora Ct
- 5962 Sandown Place
- 12359 Dapple Dr
- 12367 Dapple Dr
- 12349 Dapple Dr
- 5975 Greyville Place
- 5969 Greyville Place
- 5968 Sandown Place
- 5959 Sandown Place
- 12393 Dapple Dr
- 12343 Dapple Dr
- 5981 Greyville Place
- 5967 Sandown Place
- 5971 Sandown Place
- 12358 Dapple Dr
- 12364 Dapple Dr
- 12350 Dapple Dr
- 12399 Dapple Dr
- 12390 Dapple Dr
- 5985 Greyville Place
- 12342 Dapple Dr