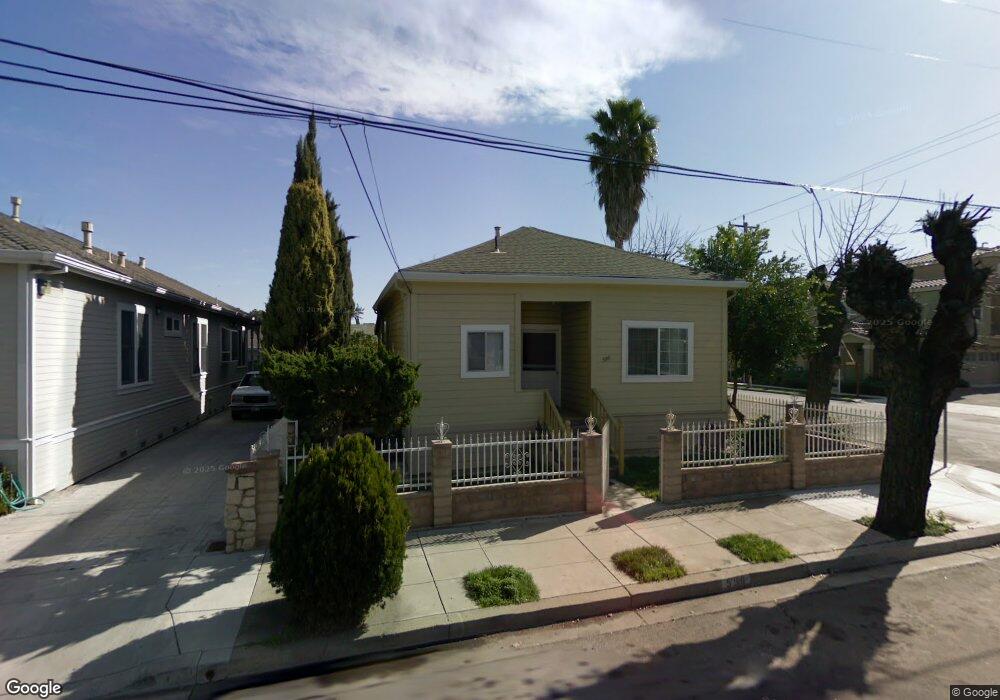
596 Harrison St San Jose, CA 95125
Willow Glen NeighborhoodEstimated Value: $1,133,813 - $1,310,000
2
Beds
1
Bath
1,092
Sq Ft
$1,090/Sq Ft
Est. Value
About This Home
This home is located at 596 Harrison St, San Jose, CA 95125 and is currently estimated at $1,189,953, approximately $1,089 per square foot. 596 Harrison St is a home located in Santa Clara County with nearby schools including Gardner Elementary School, Herbert Hoover Middle School, and Abraham Lincoln High.
Ownership History
Date
Name
Owned For
Owner Type
Purchase Details
Closed on
Apr 5, 2022
Sold by
Llamas Santiago M and Llamas Rita M
Bought by
Llamas Santiago M and Llamas Rita M
Current Estimated Value
Home Financials for this Owner
Home Financials are based on the most recent Mortgage that was taken out on this home.
Original Mortgage
$322,000
Outstanding Balance
$303,764
Interest Rate
4.67%
Mortgage Type
New Conventional
Estimated Equity
$886,189
Purchase Details
Closed on
Feb 17, 2012
Sold by
Llamas Rita M
Bought by
Llamas Santiago M and Llamas Rita M
Home Financials for this Owner
Home Financials are based on the most recent Mortgage that was taken out on this home.
Original Mortgage
$271,000
Interest Rate
3.84%
Mortgage Type
New Conventional
Purchase Details
Closed on
Oct 8, 1994
Sold by
Llamas Santiago and Llamas Rita
Bought by
Llamas Rita M
Create a Home Valuation Report for This Property
The Home Valuation Report is an in-depth analysis detailing your home's value as well as a comparison with similar homes in the area
Home Values in the Area
Average Home Value in this Area
Purchase History
| Date | Buyer | Sale Price | Title Company |
|---|---|---|---|
| Llamas Santiago M | $322,727 | Orange Coast Title | |
| Llamas Santiago M | -- | Chicago Title Company | |
| Llamas Rita M | -- | -- | |
| Llamas Rita M | -- | -- |
Source: Public Records
Mortgage History
| Date | Status | Borrower | Loan Amount |
|---|---|---|---|
| Open | Llamas Santiago M | $322,000 | |
| Previous Owner | Llamas Santiago M | $271,000 |
Source: Public Records
Tax History Compared to Growth
Tax History
| Year | Tax Paid | Tax Assessment Tax Assessment Total Assessment is a certain percentage of the fair market value that is determined by local assessors to be the total taxable value of land and additions on the property. | Land | Improvement |
|---|---|---|---|---|
| 2025 | $2,503 | $237,313 | $26,076 | $211,237 |
| 2024 | $2,503 | $69,102 | $25,565 | $43,537 |
| 2023 | $2,398 | $67,748 | $25,064 | $42,684 |
| 2022 | $2,459 | $66,421 | $24,573 | $41,848 |
| 2021 | $2,337 | $65,120 | $24,092 | $41,028 |
| 2020 | $2,239 | $64,453 | $23,845 | $40,608 |
| 2019 | $2,163 | $63,190 | $23,378 | $39,812 |
| 2018 | $2,116 | $61,952 | $22,920 | $39,032 |
| 2017 | $2,079 | $60,738 | $22,471 | $38,267 |
| 2016 | $1,937 | $59,548 | $22,031 | $37,517 |
| 2015 | $1,902 | $58,655 | $21,701 | $36,954 |
| 2014 | $1,411 | $57,507 | $21,276 | $36,231 |
Source: Public Records
Map
Nearby Homes
- 715 Harrison St
- 841 Willis Ave
- 652 Fuller Ave
- 470 Jerome St
- 502 Hannah St
- 408 Fuller Ave
- 546 Coe Ave
- 809 Auzerais Ave Unit 429
- 809 Auzerais Ave Unit 341
- 311 Bautista Place
- 747 Coe Ave
- 943 Riverside Dr
- 439 Snyder Ave
- 986 Spencer Ave
- 1025 Delmas Ave
- 975 Prevost St
- 1124 Delmas Ave
- 411 Park Ave Unit 106
- 411 Park Ave Unit 333
- 935 Chabrant Way
- 586 Harrison St
- 580 Harrison St
- 606 Harrison Terrace
- 605 Harrison Terrace
- 572 Harrison St
- 593 Bird Ave
- 612 Harrison Terrace Unit 4
- 585 Bird Ave
- 618 Harrison Terrace
- 611 Harrison Terrace
- 676 Harrison Terrace Unit 8
- 564 Harrison St
- 624 Harrison Terrace Unit 6
- 593 Harrison St
- 670 Harrison Terrace Unit 9
- 571 Bird Ave
- 589 Harrison St
- 583 Harrison St
- 675 Harrison Terrace Unit 14
- 664 Harrison Terrace Unit 10