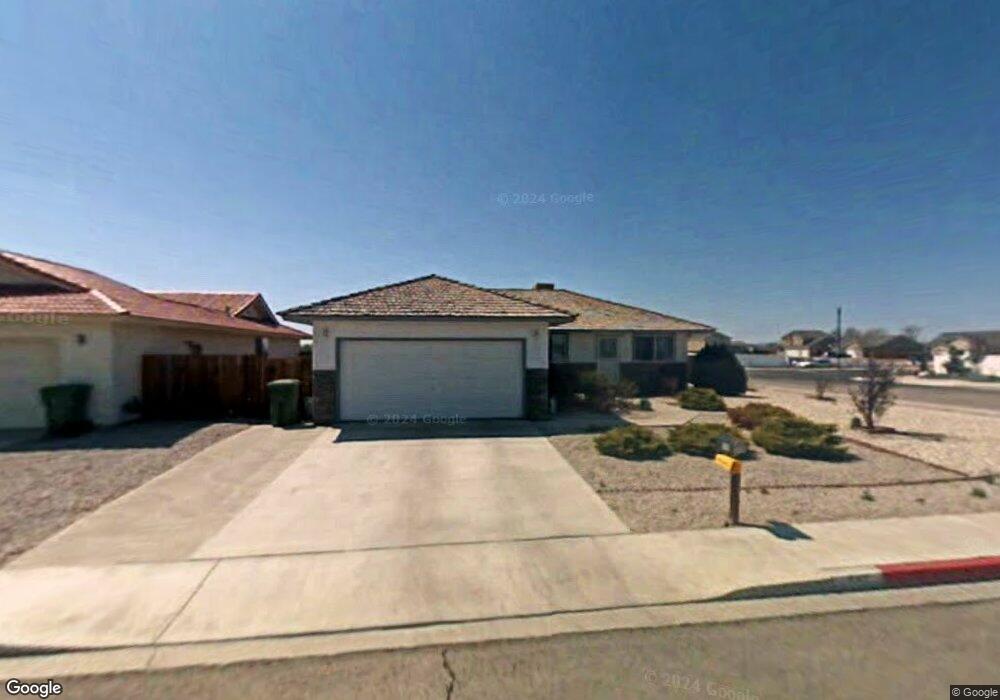
597 Venturacci Ln Fallon, NV 89406
Estimated Value: $329,000 - $348,000
3
Beds
2
Baths
1,306
Sq Ft
$261/Sq Ft
Est. Value
About This Home
This home is located at 597 Venturacci Ln, Fallon, NV 89406 and is currently estimated at $340,962, approximately $261 per square foot. 597 Venturacci Ln is a home located in Churchill County with nearby schools including Lahontan Elementary School, E.C. Best Elementary School, and Numa Elementary School.
Ownership History
Date
Name
Owned For
Owner Type
Purchase Details
Closed on
Aug 28, 2008
Sold by
Teelucksingh Clemmie
Bought by
Teelucksingh Clemmie and Soonwing Chin
Current Estimated Value
Create a Home Valuation Report for This Property
The Home Valuation Report is an in-depth analysis detailing your home's value as well as a comparison with similar homes in the area
Home Values in the Area
Average Home Value in this Area
Purchase History
| Date | Buyer | Sale Price | Title Company |
|---|---|---|---|
| Teelucksingh Clemmie | -- | None Available |
Source: Public Records
Tax History
| Year | Tax Paid | Tax Assessment Tax Assessment Total Assessment is a certain percentage of the fair market value that is determined by local assessors to be the total taxable value of land and additions on the property. | Land | Improvement |
|---|---|---|---|---|
| 2025 | $1,711 | $68,476 | $21,700 | $46,776 |
| 2024 | $1,711 | $67,157 | $19,950 | $47,207 |
| 2023 | $1,711 | $64,364 | $19,950 | $44,414 |
| 2022 | $1,609 | $50,560 | $11,900 | $38,660 |
| 2021 | $1,523 | $48,674 | $11,900 | $36,774 |
| 2020 | $1,474 | $47,114 | $11,900 | $35,214 |
| 2019 | $1,432 | $46,374 | $11,900 | $34,474 |
| 2018 | $1,390 | $45,615 | $11,900 | $33,715 |
| 2017 | $1,349 | $44,334 | $10,500 | $33,834 |
| 2016 | $1,315 | $39,070 | $7,875 | $31,195 |
| 2015 | $1,289 | $35,587 | $7,875 | $27,712 |
| 2014 | $1,257 | $33,233 | $7,875 | $25,358 |
Source: Public Records
Map
Nearby Homes
- 530 Michael Dr
- 641 Megan Way
- 775 Karry Way
- 806 Karry Way
- 1141 Alder Dr
- 285 Amanda Ln
- 119 Toiyabe Ln
- 800 Great Basin Ln
- 1755 Coleman Rd
- 815 Great Basin Ln
- 882 Great Basin Ln
- 215 Hunter Park Way
- 90 S Allen St
- 621 Keppel St
- 681 Keppel St
- 618 Keppel St
- 604 Keppel St
- 120 Hunter Park Way
- 728 Keppel St
- 343 Crystal Ct
- 583 Venturacci Ln
- 569 Venturacci Ln
- 598 Venturacci Ln Unit 8
- 608 Timber Way
- 586 Venturacci Ln
- 555 Venturacci Ln
- 574 Venturacci Ln
- 615 Timber Way
- 562 Venturacci Ln
- 626 Timber Way
- 561 Michael Dr
- 543 Venturacci Ln Unit 8
- 772 Keddie St
- 551 Michael Dr
- 905 Aspen Cir
- 921 Aspen Cir
- 0 Keddie St Unit 150001422
- 0 Keddie St Unit 190009864
- 0 Keddie St Unit 150001421
- 548 Venturacci Ln
Your Personal Tour Guide
Ask me questions while you tour the home.