
Seller's Agent in 2025
Rozi Stone
William Trew
(817) 454-0250
2 in this area
25 Total Sales
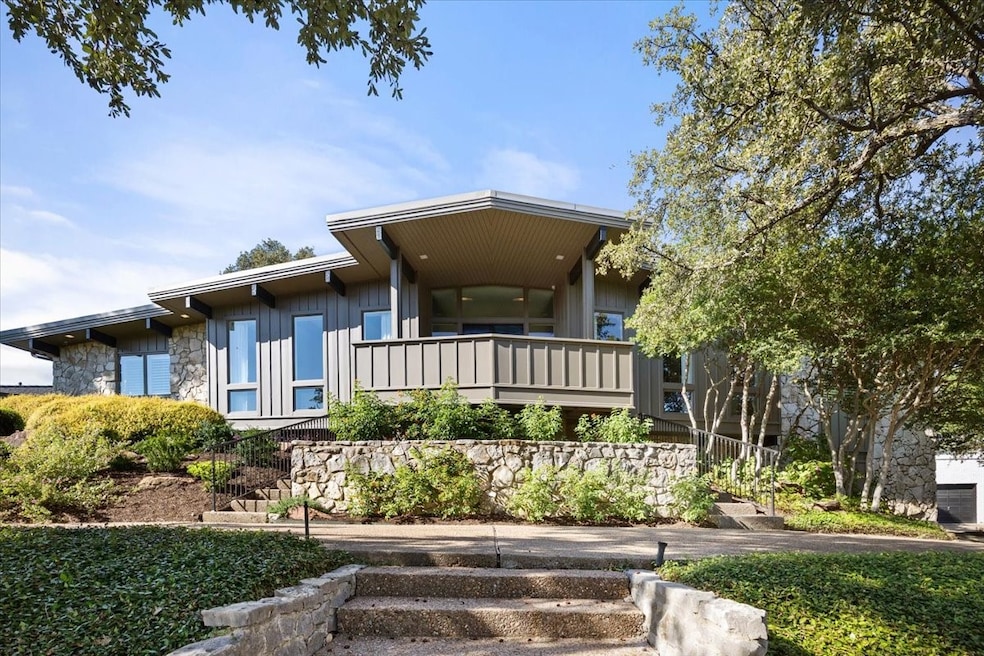


Welcome to 6 Bounty Road E., a stunning Mid-Century Modern home built on one of the highest lots in Mont Del Estates. A well-constructed home is in the details and this home includes beams that enhance the beauty of the home and ceilings but also a sturdy foundation. Completely remodeled in 2011, this beautifully renovated home has been perfectly designed for everyday living comfort and entertaining. Situated on a beautiful private lot at the highest point of the neighborhood, you can see the Fort Worth skyline on a clear day out the front and a beautiful backyard with amazing plantings and a sparkling and inviting heated pool, an ideal setting for gatherings or a quiet evening at home. More newly updated is the chef's kitchen will be your dream come true, featuring a wonderful breakfast bar and top of the line Thermador appliances. Start fixing that gourmet meal and start entertaining. You can retreat to the private primary suite, complete with a separate steam shower and tub and separate closets. The extra bedrooms are located on the opposite side of the house and share a very large bathroom with an extra large beautifully tiled shower. There is a nice separate office with great windows that looks out at the back courtyard giving you the convenience of working from the privacy of your own home. The kitchen, family room, living room and dining room are entirely open making the space feel even bigger and brighter. You can chat with everyone while cooking, socializing or relaxing, the planning and decorating is flexible. All flooring with the exception of the bathrooms are amazing authentic Chicago brick. The first driveway takes you to the garage and turns to the left to create a circle dirve in front of the house. There is an additional driveway up to the back of the house for more convenience.
Last Agent to Sell the Property
Williams Trew Real Estate Brokerage Phone: 817-454-0250 License #0591094 Listed on: 10/01/2025
| Date | Type | Sale Price | Title Company |
|---|---|---|---|
| Deed | -- | Sewell Title | |
| Vendors Lien | -- | Rattikin Title Co | |
| Warranty Deed | -- | Commonwealth Land Title | |
| Warranty Deed | -- | First American Title Co |
| Date | Status | Loan Amount | Loan Type |
|---|---|---|---|
| Open | $716,000 | VA | |
| Previous Owner | $232,000 | Purchase Money Mortgage | |
| Previous Owner | $169,600 | No Value Available | |
| Closed | $21,200 | No Value Available |
| Date | Event | Price | List to Sale | Price per Sq Ft |
|---|---|---|---|---|
| 11/17/2025 11/17/25 | Sold | -- | -- | -- |
| 10/15/2025 10/15/25 | Pending | -- | -- | -- |
| 10/01/2025 10/01/25 | For Sale | $895,000 | -- | $291 / Sq Ft |
| Year | Tax Paid | Tax Assessment Tax Assessment Total Assessment is a certain percentage of the fair market value that is determined by local assessors to be the total taxable value of land and additions on the property. | Land | Improvement |
|---|---|---|---|---|
| 2025 | $12,319 | $660,244 | $95,000 | $565,244 |
| 2024 | $12,319 | $699,787 | $95,000 | $604,787 |
| 2023 | $12,825 | $719,785 | $95,000 | $624,785 |
| 2022 | $13,449 | $561,253 | $75,000 | $486,253 |
| 2021 | $12,895 | $525,186 | $75,000 | $450,186 |
| 2020 | $11,310 | $452,693 | $75,000 | $377,693 |
| 2019 | $11,967 | $500,253 | $75,000 | $425,253 |
| 2018 | $10,509 | $420,603 | $75,000 | $345,603 |
| 2017 | $10,262 | $420,603 | $75,000 | $345,603 |
| 2016 | $9,329 | $354,918 | $75,000 | $279,918 |
| 2015 | $9,435 | $398,976 | $35,000 | $363,976 |
| 2014 | $9,435 | $368,800 | $35,000 | $333,800 |
Seller's Agent in 2025
Rozi Stone
William Trew
(817) 454-0250
2 in this area
25 Total Sales
Buyer's Agent in 2025
Sean Hassard
TK Realty
(972) 515-9361
6 in this area
95 Total Sales
Source: North Texas Real Estate Information Systems (NTREIS)
MLS Number: 21067502
APN: 01795082
Disclaimer: Certain information contained herein is derived from information provided by parties other than Homes.com. All information provided is deemed reliable, but is not guaranteed to be accurate and should be independently verified.
![]() Listing information provided in part by the North Texas Real Estate Information Systems, Inc, for personal, non-commercial use by viewers of this site and may not be reproduced or redistributed. All information is deemed reliable but not guaranteed. Copyright © NTREIS 2026. All rights reserved
Listing information provided in part by the North Texas Real Estate Information Systems, Inc, for personal, non-commercial use by viewers of this site and may not be reproduced or redistributed. All information is deemed reliable but not guaranteed. Copyright © NTREIS 2026. All rights reserved
Ask me questions while you tour the home.