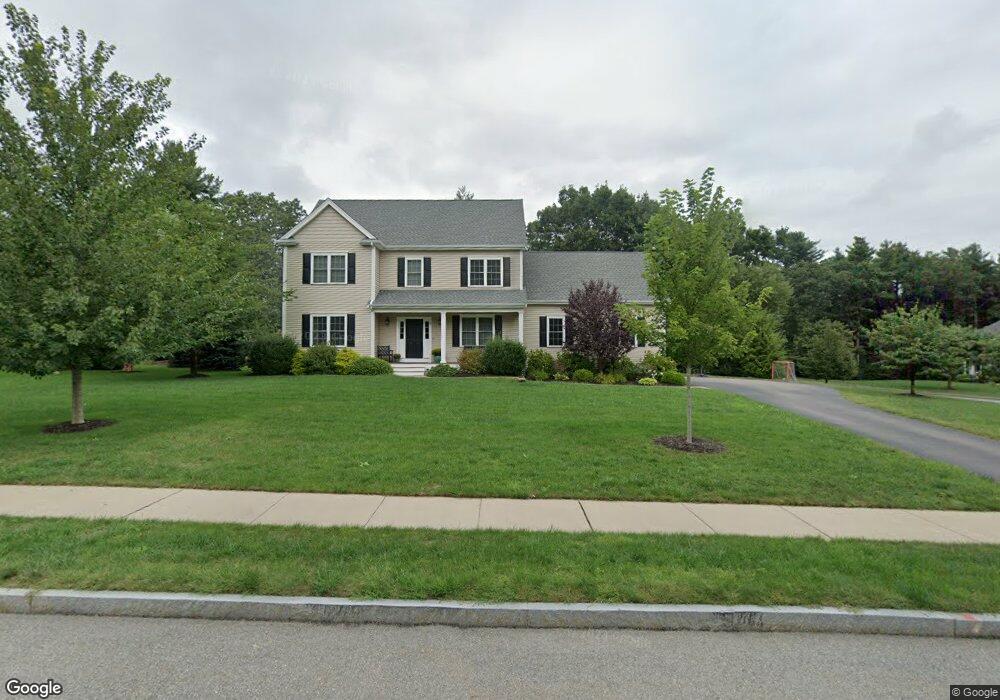
6 Brielle Way Franklin, MA 02038
Wadsworth NeighborhoodEstimated Value: $821,000 - $1,045,000
4
Beds
3
Baths
2,116
Sq Ft
$437/Sq Ft
Est. Value
About This Home
This home is located at 6 Brielle Way, Franklin, MA 02038 and is currently estimated at $925,357, approximately $437 per square foot. 6 Brielle Way is a home with nearby schools including Jefferson Elementary School, Remington Middle School, and Franklin High School.
Ownership History
Date
Name
Owned For
Owner Type
Purchase Details
Closed on
Oct 9, 2012
Sold by
Norfolk County Homes I
Bought by
Baker Dean C and Baker Jeanne L
Current Estimated Value
Home Financials for this Owner
Home Financials are based on the most recent Mortgage that was taken out on this home.
Original Mortgage
$396,000
Outstanding Balance
$276,147
Interest Rate
3.66%
Mortgage Type
New Conventional
Estimated Equity
$649,210
Purchase Details
Closed on
May 22, 2012
Sold by
Costantine Builders In
Bought by
Norfolk County Homes I
Home Financials for this Owner
Home Financials are based on the most recent Mortgage that was taken out on this home.
Original Mortgage
$371,000
Interest Rate
4.01%
Mortgage Type
New Conventional
Create a Home Valuation Report for This Property
The Home Valuation Report is an in-depth analysis detailing your home's value as well as a comparison with similar homes in the area
Home Values in the Area
Average Home Value in this Area
Purchase History
| Date | Buyer | Sale Price | Title Company |
|---|---|---|---|
| Baker Dean C | $495,000 | -- | |
| Norfolk County Homes I | $214,000 | -- |
Source: Public Records
Mortgage History
| Date | Status | Borrower | Loan Amount |
|---|---|---|---|
| Open | Baker Dean C | $396,000 | |
| Previous Owner | Norfolk County Homes I | $371,000 |
Source: Public Records
Tax History Compared to Growth
Tax History
| Year | Tax Paid | Tax Assessment Tax Assessment Total Assessment is a certain percentage of the fair market value that is determined by local assessors to be the total taxable value of land and additions on the property. | Land | Improvement |
|---|---|---|---|---|
| 2025 | $9,067 | $780,300 | $333,700 | $446,600 |
| 2024 | $8,735 | $740,900 | $333,700 | $407,200 |
| 2023 | $8,768 | $697,000 | $289,800 | $407,200 |
| 2022 | $8,174 | $581,800 | $219,600 | $362,200 |
| 2021 | $8,986 | $613,400 | $244,100 | $369,300 |
| 2020 | $8,423 | $580,500 | $227,900 | $352,600 |
| 2019 | $8,390 | $572,300 | $219,900 | $352,400 |
| 2018 | $7,833 | $534,700 | $215,800 | $318,900 |
| 2017 | $7,398 | $507,400 | $201,700 | $305,700 |
| 2016 | $6,972 | $480,800 | $204,300 | $276,500 |
| 2015 | $7,058 | $475,600 | $199,100 | $276,500 |
| 2014 | $6,518 | $451,100 | $174,600 | $276,500 |
Source: Public Records
Map
Nearby Homes
- 236 Williams St
- 584 Washington St
- 17 Stanford Rd
- 10 Stanford Rd
- 50 Wamsutta Way
- 732 King St
- 851 Washington St
- 1 Spring St
- 955 Summer St
- 246 Washington St
- 2095 West St
- 6 Woodchester Rd
- 0 Fall Ln
- 8 Bubbling Brook Rd
- 55 Lawrence Dr Unit 55
- 50 Heather Ln
- 29 Lawrence Dr
- 60 Grant Ave
- 417 Union St
- 440 Chestnut St