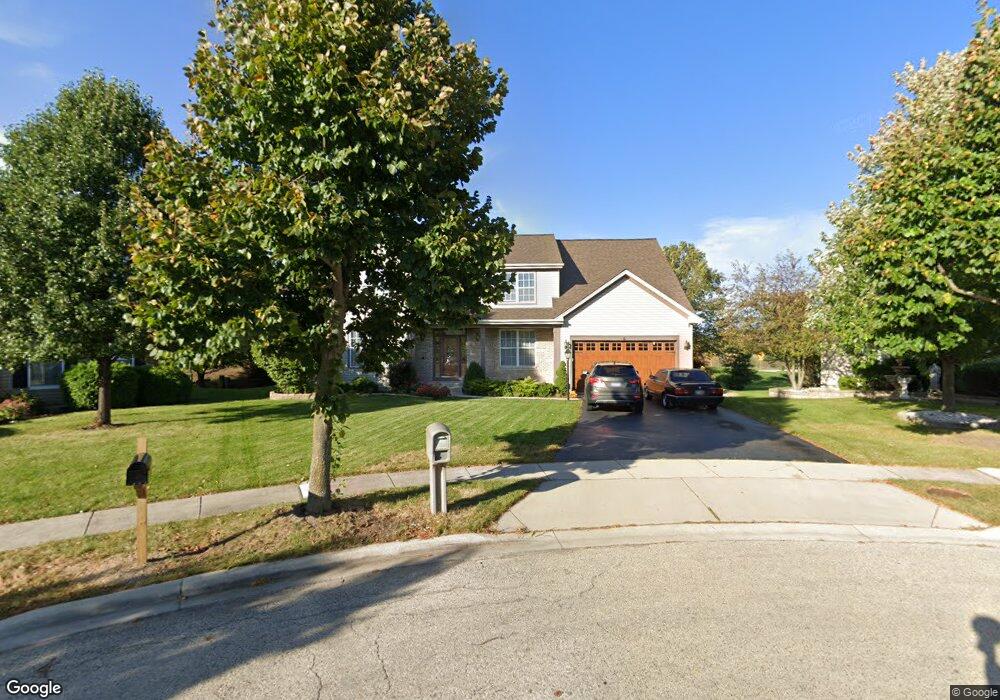
6 Joyce Ct Algonquin, IL 60102
Estimated Value: $497,000 - $539,000
3
Beds
3
Baths
2,810
Sq Ft
$185/Sq Ft
Est. Value
About This Home
This home is located at 6 Joyce Ct, Algonquin, IL 60102 and is currently estimated at $519,333, approximately $184 per square foot. 6 Joyce Ct is a home located in Kane County with nearby schools including Westfield Community School and Harry D Jacobs High School.
Ownership History
Date
Name
Owned For
Owner Type
Purchase Details
Closed on
Mar 29, 2007
Sold by
Bean Maurice F
Bought by
Andrews Donald C and Andrews Beverly L
Current Estimated Value
Home Financials for this Owner
Home Financials are based on the most recent Mortgage that was taken out on this home.
Original Mortgage
$284,000
Interest Rate
6.21%
Mortgage Type
Purchase Money Mortgage
Purchase Details
Closed on
May 28, 2005
Sold by
Bean Maurice F and Bean Jennifer D
Bought by
Bean Maurice F and Bean Jennifer D
Purchase Details
Closed on
Aug 30, 2000
Sold by
Willoughby Farms Lp
Bought by
Bean Maurice F and Bean Jennifer D
Home Financials for this Owner
Home Financials are based on the most recent Mortgage that was taken out on this home.
Original Mortgage
$213,702
Interest Rate
8.14%
Mortgage Type
FHA
Create a Home Valuation Report for This Property
The Home Valuation Report is an in-depth analysis detailing your home's value as well as a comparison with similar homes in the area
Purchase History
| Date | Buyer | Sale Price | Title Company |
|---|---|---|---|
| Andrews Donald C | $355,000 | Greater Illinois Title Co | |
| Bean Maurice F | -- | -- | |
| Bean Maurice F | $250,500 | Stewart Title Company |
Source: Public Records
Mortgage History
| Date | Status | Borrower | Loan Amount |
|---|---|---|---|
| Previous Owner | Andrews Donald C | $284,000 | |
| Previous Owner | Bean Maurice F | $213,702 |
Source: Public Records
Tax History
| Year | Tax Paid | Tax Assessment Tax Assessment Total Assessment is a certain percentage of the fair market value that is determined by local assessors to be the total taxable value of land and additions on the property. | Land | Improvement |
|---|---|---|---|---|
| 2024 | $9,837 | $145,892 | $24,205 | $121,687 |
| 2023 | $9,275 | $131,269 | $21,779 | $109,490 |
| 2022 | $9,190 | $122,558 | $21,779 | $100,779 |
| 2021 | $8,888 | $115,719 | $20,564 | $95,155 |
| 2020 | $8,699 | $113,118 | $20,102 | $93,016 |
| 2019 | $8,408 | $107,384 | $19,083 | $88,301 |
| 2018 | $8,456 | $105,258 | $18,705 | $86,553 |
| 2017 | $8,534 | $98,464 | $17,498 | $80,966 |
| 2016 | $8,295 | $90,738 | $16,942 | $73,796 |
| 2015 | -- | $84,169 | $17,040 | $67,129 |
| 2014 | -- | $82,143 | $16,569 | $65,574 |
| 2013 | -- | $84,657 | $17,076 | $67,581 |
Source: Public Records
Map
Nearby Homes
- 2258 Stonegate Rd
- 1101 Waterford St
- 1121 Waterford St
- 1951 Broadsmore Dr
- 120 Newburgh Ln
- 2313 Barrett Dr
- 1090 Glenmont St
- 1247 Glenmont St
- 1111 Glenmont St
- 1243 Glenmont St
- 1080 Glenmont St
- 1249 Glenmont St
- 1245 Glenmont St
- 1020 Glenmont St
- 1191 Waterford St
- 1262 Glenmont St
- 150 Newburgh Ln
- 1201 Waterford St
- 2254 Stonegate Rd
- 1256 Glenmont St
Your Personal Tour Guide
Ask me questions while you tour the home.