
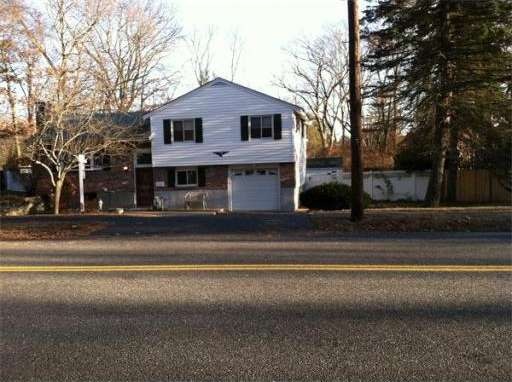
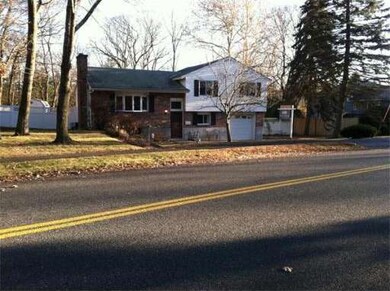
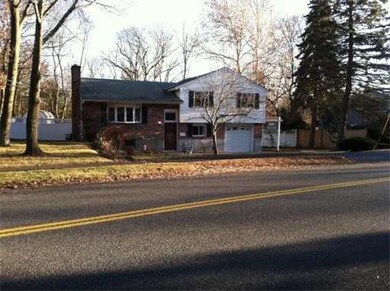
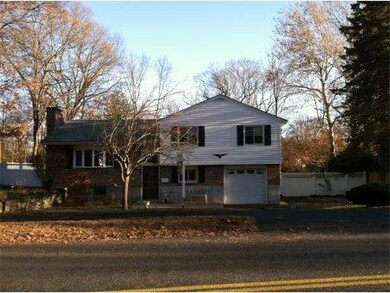
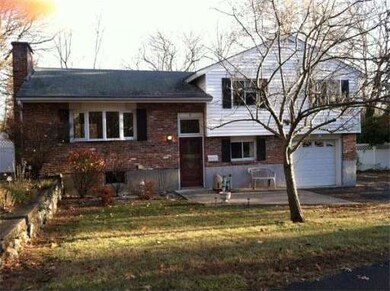
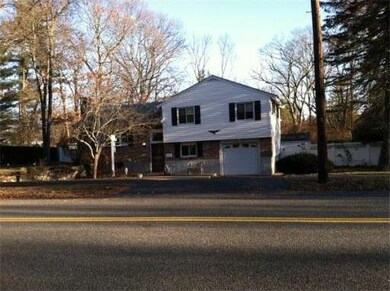

6 Lyman Rd Framingham, MA 01701
Nobscot Neighborhood
3
Beds
2
Baths
1,895
Sq Ft
0.47
Acres
About This Home
As of October 2020OPEN-HOUSE, SUNDAY 12:30-2 North Framingham location... Bright, spacious multi level home consisting of 3 bedrooms, 1.5 bath,gleaming hardwood floors, central air, 1 car garage, in-ground pool, spacious finished lower level, updated kitchen, dining room with access to deck and large livingroom with fireplace and beautiful bow window. This lovely home is situated on 20,473 of land. WELCOME HOME!!!.
Last Agent to Sell the Property
Berkshire Hathaway HomeServices Commonwealth Real Estate Listed on: 11/19/2013
Ownership History
Date
Name
Owned For
Owner Type
Purchase Details
Closed on
Apr 19, 2021
Sold by
Melendez Edgardo J
Bought by
Melendez Edgardo J and Hozid Jessica
Total Days on Market
93
Current Estimated Value
Purchase Details
Closed on
Sep 18, 2012
Sold by
Waldron-Burke Teresa A
Bought by
Lyman Road Rt and Waldron-Burke
Purchase Details
Closed on
Oct 20, 2011
Sold by
Waldron Concetta P Est and Paul
Bought by
Waldron-Burke Teresa A
Purchase Details
Closed on
Jul 29, 2002
Sold by
Reynolds Steven T
Bought by
Waldron Concetta P and Waldron-Burke Teresa
Purchase Details
Closed on
Oct 12, 1995
Sold by
Ibarra Raymond
Bought by
Reynolds Karen A and Reynolds Steven T
Home Financials for this Owner
Home Financials are based on the most recent Mortgage that was taken out on this home.
Original Mortgage
$100,000
Interest Rate
7.71%
Mortgage Type
Purchase Money Mortgage
Similar Homes in Framingham, MA
Create a Home Valuation Report for This Property
The Home Valuation Report is an in-depth analysis detailing your home's value as well as a comparison with similar homes in the area
Home Values in the Area
Average Home Value in this Area
Purchase History
| Date | Type | Sale Price | Title Company |
|---|---|---|---|
| Quit Claim Deed | -- | None Available | |
| Quit Claim Deed | -- | None Available | |
| Deed | -- | -- | |
| Deed | -- | -- | |
| Deed | -- | -- | |
| Deed | -- | -- | |
| Deed | $349,900 | -- | |
| Deed | $349,900 | -- | |
| Deed | $163,000 | -- | |
| Deed | $163,000 | -- |
Source: Public Records
Mortgage History
| Date | Status | Loan Amount | Loan Type |
|---|---|---|---|
| Open | $100,000 | Second Mortgage Made To Cover Down Payment | |
| Previous Owner | $470,450 | New Conventional | |
| Previous Owner | $284,000 | Stand Alone Refi Refinance Of Original Loan | |
| Previous Owner | $285,000 | New Conventional | |
| Previous Owner | $100,000 | Purchase Money Mortgage |
Source: Public Records
Property History
| Date | Event | Price | Change | Sq Ft Price |
|---|---|---|---|---|
| 10/28/2020 10/28/20 | Sold | $485,000 | -3.0% | $256 / Sq Ft |
| 09/02/2020 09/02/20 | Pending | -- | -- | -- |
| 08/25/2020 08/25/20 | For Sale | $499,900 | +63.9% | $264 / Sq Ft |
| 04/23/2014 04/23/14 | Sold | $305,000 | -3.1% | $161 / Sq Ft |
| 02/20/2014 02/20/14 | Pending | -- | -- | -- |
| 11/19/2013 11/19/13 | For Sale | $314,900 | -- | $166 / Sq Ft |
Source: MLS Property Information Network (MLS PIN)
Tax History Compared to Growth
Tax History
| Year | Tax Paid | Tax Assessment Tax Assessment Total Assessment is a certain percentage of the fair market value that is determined by local assessors to be the total taxable value of land and additions on the property. | Land | Improvement |
|---|---|---|---|---|
| 2025 | $7,085 | $593,400 | $271,700 | $321,700 |
| 2024 | $6,644 | $533,200 | $242,700 | $290,500 |
| 2023 | $6,287 | $480,300 | $216,600 | $263,700 |
| 2022 | $5,949 | $433,000 | $196,600 | $236,400 |
| 2021 | $5,814 | $413,800 | $188,900 | $224,900 |
| 2020 | $5,730 | $382,500 | $171,700 | $210,800 |
| 2019 | $5,663 | $368,200 | $171,700 | $196,500 |
| 2018 | $5,594 | $342,800 | $165,300 | $177,500 |
| 2017 | $5,588 | $334,400 | $160,500 | $173,900 |
| 2016 | $5,449 | $313,500 | $160,500 | $153,000 |
| 2015 | $5,293 | $297,000 | $160,800 | $136,200 |
Source: Public Records
Agents Affiliated with this Home
-
T
Seller's Agent in 2020
The Allain + Warren Group
Compass
-
Mark O'hare
Buyer's Agent in 2020
Mark O'hare
RTN Realty Advisors LLC.
(617) 584-2060
1 in this area
10 Total Sales
-
Anita Hebert
A
Seller's Agent in 2014
Anita Hebert
Berkshire Hathaway HomeServices Commonwealth Real Estate
(617) 448-4301
17 Total Sales
-
Mary Ellen Hoey
Buyer's Agent in 2014
Mary Ellen Hoey
Berkshire Hathaway HomeServices Page Realty
(508) 254-8746
57 Total Sales
Map
Source: MLS Property Information Network (MLS PIN)
MLS Number: 71609865
APN: FRAM-000047-000022-008257
Disclaimer: Certain information contained herein is derived from information provided by parties other than Homes.com. All information provided is deemed reliable, but is not guaranteed to be accurate and should be independently verified.
![]() The property listing data and information, or the Images, set forth herein were provided to MLS Property Information Network, Inc. from third party sources, including sellers, lessors and public records, and were compiled by MLS Property Information Network, Inc. The property listing data and information, and the Images, are for the personal, non-commercial use of consumers having a good faith interest in purchasing or leasing listed properties of the type displayed to them and may not be used for any purpose other than to identify prospective properties which such consumers may have a good faith interest in purchasing or leasing. MLS Property Information Network, Inc. and its subscribers disclaim any and all representations and warranties as to the accuracy of the property listing data and information, or as to the accuracy of any of the Images, set forth herein.
The property listing data and information, or the Images, set forth herein were provided to MLS Property Information Network, Inc. from third party sources, including sellers, lessors and public records, and were compiled by MLS Property Information Network, Inc. The property listing data and information, and the Images, are for the personal, non-commercial use of consumers having a good faith interest in purchasing or leasing listed properties of the type displayed to them and may not be used for any purpose other than to identify prospective properties which such consumers may have a good faith interest in purchasing or leasing. MLS Property Information Network, Inc. and its subscribers disclaim any and all representations and warranties as to the accuracy of the property listing data and information, or as to the accuracy of any of the Images, set forth herein.
Nearby Homes