6 Perkley Ln Riverside, CT 06878
Estimated Value: $5,637,879 - $6,772,000
5
Beds
6
Baths
6,283
Sq Ft
$985/Sq Ft
Est. Value
About This Home
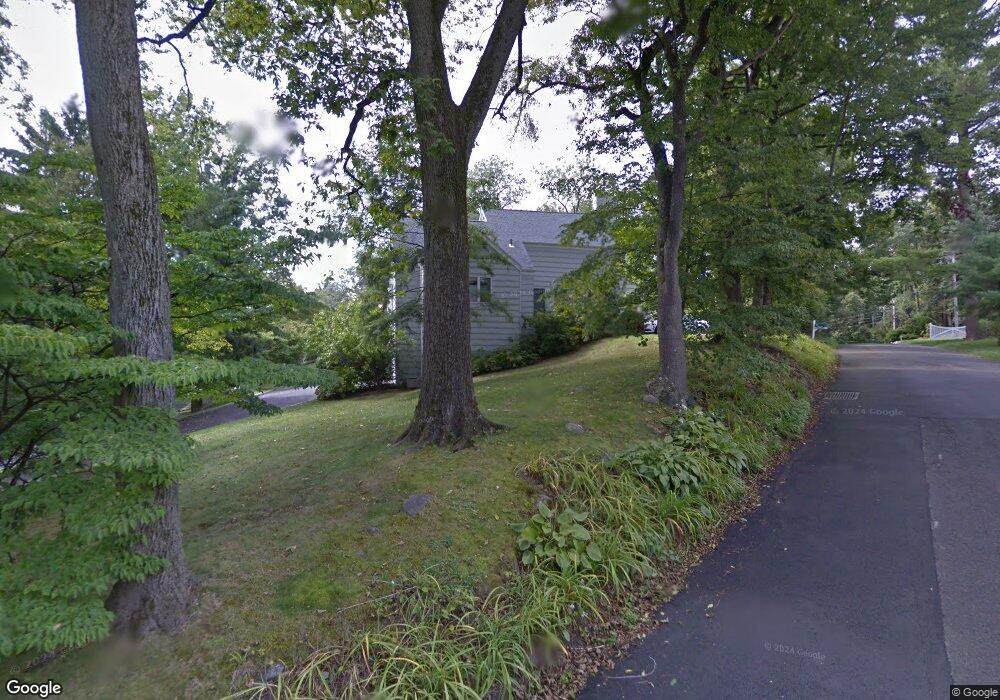
This home is located at 6 Perkley Ln, Riverside, CT 06878 and is currently estimated at $6,191,293, approximately $985 per square foot. 6 Perkley Ln is a home located in Fairfield County with nearby schools including Riverside School, Eastern Middle School, and Greenwich High School.
Ownership History
Date
Name
Owned For
Owner Type
Purchase Details
Closed on
Sep 10, 2020
Sold by
Dabrowski Michael and Rice-Mcclure Brooke
Bought by
Harlow Holly and Harlow Matthew R
Current Estimated Value
Home Financials for this Owner
Home Financials are based on the most recent Mortgage that was taken out on this home.
Original Mortgage
$2,956,000
Outstanding Balance
$2,610,009
Interest Rate
2.63%
Mortgage Type
Purchase Money Mortgage
Estimated Equity
$3,581,284
Purchase Details
Closed on
Aug 19, 1987
Sold by
Pritchard Francis
Bought by
Whitmer John
Home Financials for this Owner
Home Financials are based on the most recent Mortgage that was taken out on this home.
Original Mortgage
$640,000
Interest Rate
10.29%
Create a Home Valuation Report for This Property
The Home Valuation Report is an in-depth analysis detailing your home's value as well as a comparison with similar homes in the area
Home Values in the Area
Average Home Value in this Area
Purchase History
| Date | Buyer | Sale Price | Title Company |
|---|---|---|---|
| Harlow Holly | $3,695,000 | None Available | |
| Whitmer John | $575,000 | -- |
Source: Public Records
Mortgage History
| Date | Status | Borrower | Loan Amount |
|---|---|---|---|
| Open | Harlow Holly | $2,956,000 | |
| Previous Owner | Whitmer John | $375,000 | |
| Previous Owner | Whitmer John | $392,500 | |
| Previous Owner | Whitmer John | $640,000 |
Source: Public Records
Tax History
| Year | Tax Paid | Tax Assessment Tax Assessment Total Assessment is a certain percentage of the fair market value that is determined by local assessors to be the total taxable value of land and additions on the property. | Land | Improvement |
|---|---|---|---|---|
| 2025 | $32,960 | $2,666,860 | $1,107,750 | $1,559,110 |
| 2024 | $31,832 | $2,666,860 | $1,107,750 | $1,559,110 |
| 2023 | $31,032 | $2,666,860 | $1,107,750 | $1,559,110 |
| 2022 | $30,749 | $2,666,860 | $1,107,750 | $1,559,110 |
| 2021 | $33,315 | $2,767,030 | $855,190 | $1,911,840 |
| 2020 | $33,260 | $2,767,030 | $855,190 | $1,911,840 |
| 2019 | $12,530 | $1,032,150 | $855,190 | $176,960 |
| 2018 | $12,328 | $996,590 | $855,190 | $141,400 |
| 2017 | $18,872 | $1,570,170 | $855,120 | $715,050 |
| 2016 | $18,574 | $1,570,170 | $855,120 | $715,050 |
| 2015 | $17,229 | $1,444,800 | $985,670 | $459,130 |
| 2014 | $16,796 | $1,444,800 | $985,670 | $459,130 |
Source: Public Records
Map
Nearby Homes
Your Personal Tour Guide
Ask me questions while you tour the home.