60 Pine St Needham, MA 02492
Needham AreaEstimated Value: $2,031,000 - $2,889,292
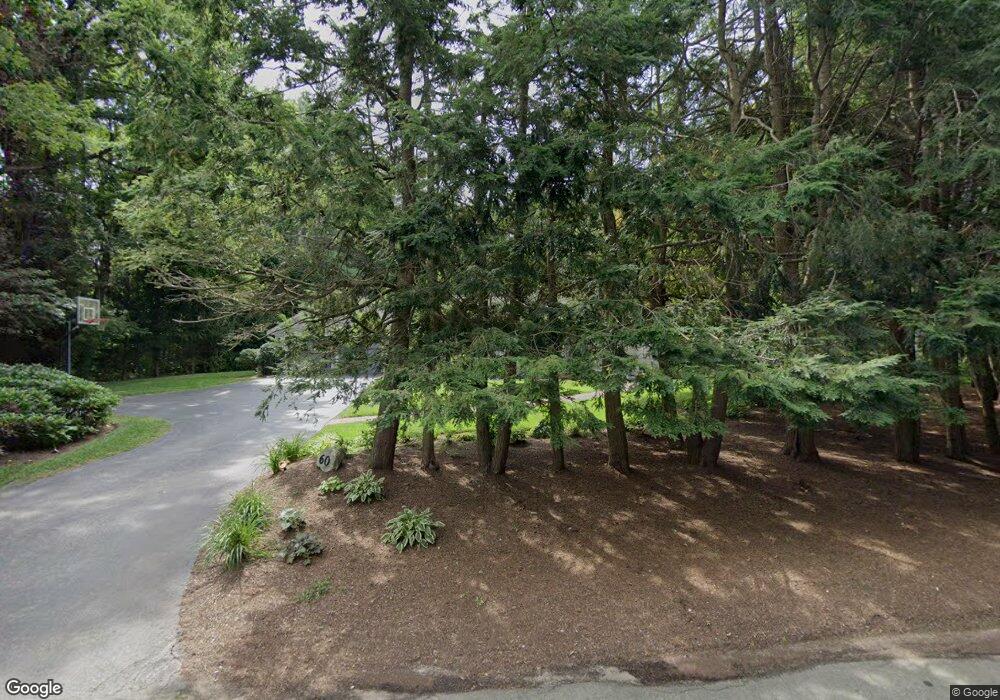
About This Home
This home is located at 60 Pine St, Needham, MA 02492 and is currently estimated at $2,316,823, approximately $696 per square foot. 60 Pine St is a home located in Norfolk County with nearby schools including Newman Elementary School, High Rock Middle School, and Pollard Middle School.
Ownership History
We collect this data history from publicly available records. To have your information removed, we recommend requesting removal directly through your county’s website.
Purchase Details
Purchase Details
Home Values in the Area
Average Home Value in this Area
Purchase History
We collect this data history from publicly available records. To have your information removed, we recommend requesting removal directly through your county’s website.
| Date | Buyer | Sale Price | Title Company |
|---|---|---|---|
| $478,000 | -- | ||
| $272,500 | -- |
Mortgage History
We collect this data history from publicly available records. To have your information removed, we recommend requesting removal directly through your county’s website.
| Date | Status | Borrower | Loan Amount |
|---|---|---|---|
| Open | $400,000 | ||
| Closed | $380,000 | ||
| Closed | $290,000 | ||
| Closed | $321,000 | ||
| Closed | $335,000 | ||
| Closed | $400,000 | ||
| Closed | $420,000 | ||
| Closed | $420,000 |
Tax History
We collect this data history from publicly available records. To have your information removed, we recommend requesting removal directly through your county’s website.
| Year | Tax Paid | Tax Assessment Tax Assessment Total Assessment is a certain percentage of the fair market value that is determined by local assessors to be the total taxable value of land and additions on the property. | Land | Improvement |
|---|---|---|---|---|
| 2025 | $15,283 | $1,441,800 | $886,900 | $554,900 |
| 2024 | $15,531 | $1,240,500 | $791,200 | $449,300 |
| 2023 | $15,737 | $1,206,800 | $791,200 | $415,600 |
| 2022 | $14,230 | $1,064,300 | $665,000 | $399,300 |
| 2021 | $13,868 | $1,064,300 | $665,000 | $399,300 |
| 2020 | $13,377 | $1,071,000 | $665,700 | $405,300 |
| 2019 | $13,161 | $1,062,200 | $665,700 | $396,500 |
| 2018 | $12,619 | $1,062,200 | $665,700 | $396,500 |
| 2017 | $12,488 | $1,050,300 | $700,700 | $349,600 |
| 2016 | $12,120 | $1,050,300 | $700,700 | $349,600 |
| 2015 | $11,858 | $1,050,300 | $700,700 | $349,600 |
| 2014 | $12,085 | $1,038,200 | $700,700 | $337,500 |
Map
- 365 Charles River St
- 1780 Central Ave
- 98 Bridle Trail Rd
- 50 Oxbow Rd
- 37 Moseley Ave
- 125 Oxbow Rd
- 46 Charles River St
- 298 Marked Tree Rd
- 8 Crestview Rd
- 1275 Central Ave
- 620 High Rock St
- 29 Canavan Cir
- 389 Grove St
- 430 High Rock St
- 62 Claybrook Rd
- 10 Colgate Rd
- 26 Carol Rd
- 80 Locust Ln
- 373 High Rock St
- 68 Locust Ln
Ask me questions while you tour the home.