Estimated Value: $394,000 - $517,000
4
Beds
3
Baths
1,341
Sq Ft
$349/Sq Ft
Est. Value
About This Home
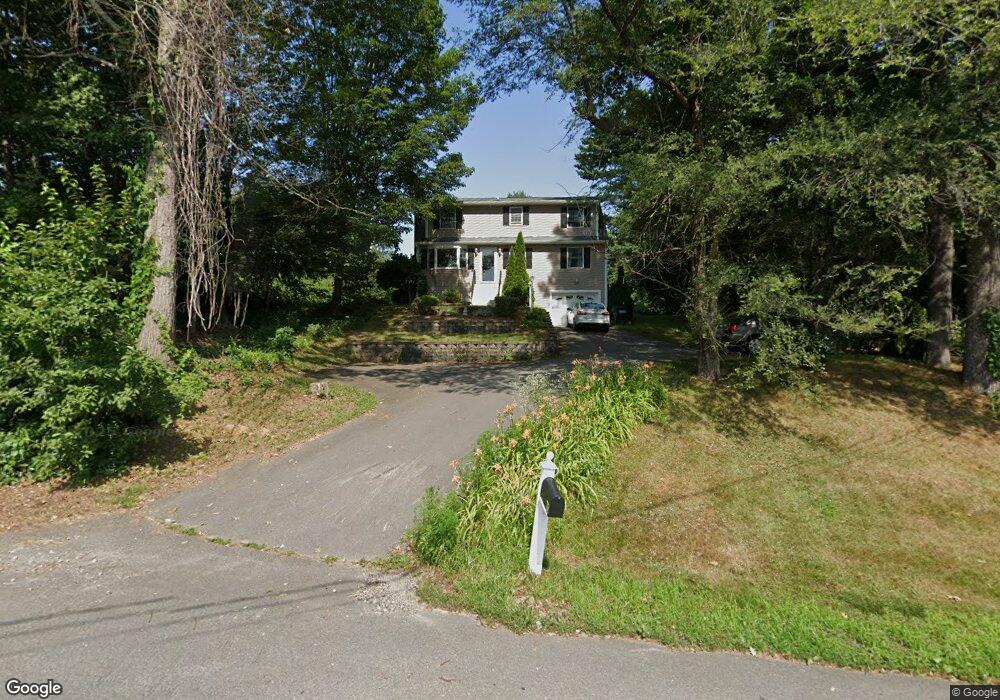
This home is located at 60 Tsienneto Rd, Derry, NH 03038 and is currently estimated at $468,245, approximately $349 per square foot. 60 Tsienneto Rd is a home located in Rockingham County with nearby schools including Ernest P. Barka Elementary School, Gilbert H. Hood Middle School, and Pinkerton Academy.
Ownership History
Date
Name
Owned For
Owner Type
Purchase Details
Closed on
Nov 5, 2014
Sold by
Sanroma Douglas G and Sanroma Jessica L
Bought by
Sanroma Jessica L
Current Estimated Value
Purchase Details
Closed on
Dec 23, 1999
Sold by
Campisi Sandra G
Bought by
Sanroma Douglas G and Sanroma Jessica L
Home Financials for this Owner
Home Financials are based on the most recent Mortgage that was taken out on this home.
Original Mortgage
$100,500
Interest Rate
7.61%
Purchase Details
Closed on
Jan 29, 1997
Sold by
Hakenson Frances
Bought by
Campisi Sandra G
Home Financials for this Owner
Home Financials are based on the most recent Mortgage that was taken out on this home.
Original Mortgage
$82,822
Interest Rate
7.65%
Create a Home Valuation Report for This Property
The Home Valuation Report is an in-depth analysis detailing your home's value as well as a comparison with similar homes in the area
Home Values in the Area
Average Home Value in this Area
Purchase History
| Date | Buyer | Sale Price | Title Company |
|---|---|---|---|
| Sanroma Jessica L | -- | -- | |
| Sanroma Douglas G | $126,000 | -- | |
| Campisi Sandra G | $82,900 | -- |
Source: Public Records
Mortgage History
| Date | Status | Borrower | Loan Amount |
|---|---|---|---|
| Previous Owner | Campisi Sandra G | $100,500 | |
| Previous Owner | Campisi Sandra G | $82,822 |
Source: Public Records
Tax History Compared to Growth
Tax History
| Year | Tax Paid | Tax Assessment Tax Assessment Total Assessment is a certain percentage of the fair market value that is determined by local assessors to be the total taxable value of land and additions on the property. | Land | Improvement |
|---|---|---|---|---|
| 2024 | $7,512 | $401,900 | $185,800 | $216,100 |
| 2023 | $7,492 | $362,300 | $157,800 | $204,500 |
| 2022 | $6,898 | $362,300 | $157,800 | $204,500 |
| 2021 | $6,477 | $261,600 | $119,800 | $141,800 |
| 2020 | $6,367 | $261,600 | $119,800 | $141,800 |
| 2019 | $6,021 | $230,500 | $90,700 | $139,800 |
| 2018 | $6,130 | $235,500 | $90,700 | $144,800 |
| 2017 | $6,026 | $208,800 | $86,200 | $122,600 |
| 2016 | $5,650 | $208,800 | $86,200 | $122,600 |
| 2015 | $5,671 | $194,000 | $86,200 | $107,800 |
| 2014 | $5,707 | $194,000 | $86,200 | $107,800 |
| 2013 | $5,926 | $188,200 | $78,900 | $109,300 |
Source: Public Records
Map
Nearby Homes
- 1 Barkland Dr
- 51 Chester Rd
- 3 Pembroke Dr Unit 20
- 2 Pembroke Dr Unit 21
- 2 Silvestri Cir Unit 6
- 80 Bypass 28
- 5 Nesmith St
- 5 Tsienneto Rd Unit 10
- 5 Tsienneto Rd Unit 127
- 5 Tsienneto Rd Unit 170
- 5 Tsienneto Rd Unit 41
- 5 Tsienneto Rd Unit 151
- 12 Orchard Dr
- 7 Chester Rd Unit 211
- 7 Chester Rd Unit 212
- 4C Pine Isle Dr Unit B
- 80.5 English Range Rd
- 7 Dexter St
- 12 Perley Rd Unit 21
- 12 Beaver Lake Rd
- 1 Horseshoe Dr
- 62 Tsienneto Rd
- 5 Horseshoe Dr
- 3 Horseshoe Dr
- 73L Tsienneto Rd Unit R331
- 64 Tsienneto Rd
- 73 Tsienneto Rd Unit R
- 73 Tsienneto Rd
- 73 Tsienneto Rd Unit 73
- 71 Tsienneto Rd Unit R
- 71 Tsienneto Rd Unit L
- 71L Tsienneto Rd
- 71R Tsienneto Rd
- 7 Horseshoe Dr
- 75 Tsienneto Rd
- 69 Tsienneto Rd Unit R
- 69 Tsienneto Rd Unit L
- 69 Tsienneto Rd Unit 69L
- 56 Tsienneto Rd
- 2 Horseshoe Dr