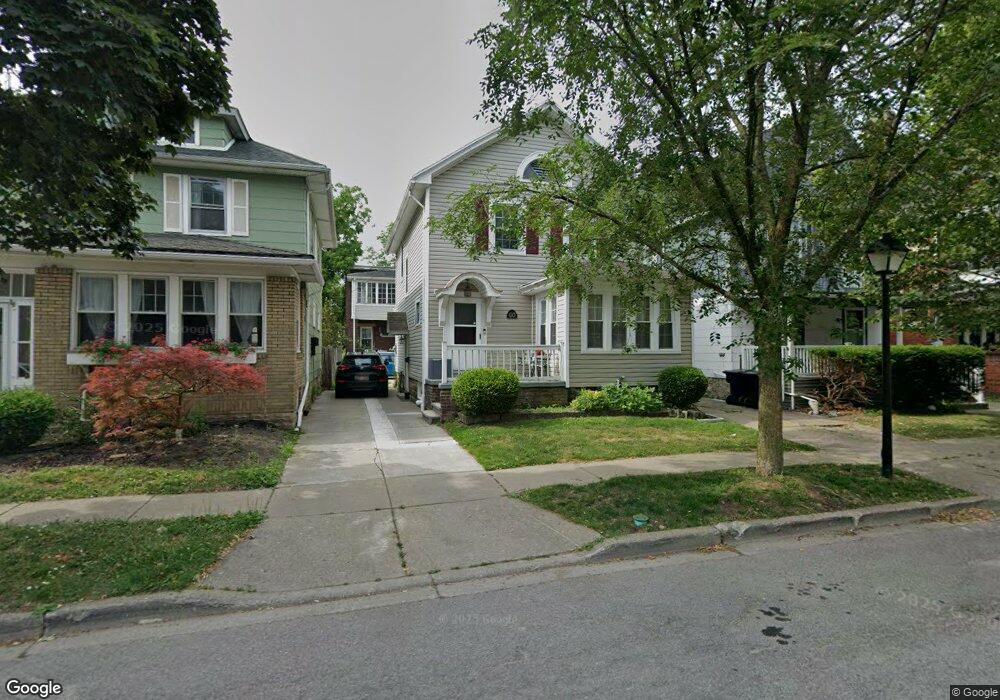
60 W Hazeltine Ave Buffalo, NY 14217
Estimated Value: $167,000 - $298,000
3
Beds
1
Bath
1,416
Sq Ft
$169/Sq Ft
Est. Value
About This Home
This home is located at 60 W Hazeltine Ave, Buffalo, NY 14217 and is currently estimated at $240,000, approximately $169 per square foot. 60 W Hazeltine Ave is a home located in Erie County with nearby schools including Charles A Lindbergh Elementary School, Herbert Hoover Middle School, and Kenmore West Senior High School.
Ownership History
Date
Name
Owned For
Owner Type
Purchase Details
Closed on
Apr 27, 2024
Sold by
Bricks & Mortar Properties Llc
Bought by
Elliott Rose Real Estate Holdings Llc
Current Estimated Value
Purchase Details
Closed on
Oct 24, 2013
Sold by
Autonomous Development Llc
Bought by
Bricks & Mortar Properties Llc
Purchase Details
Closed on
Jun 5, 2008
Sold by
Candino Christopher
Bought by
Autonomous Development Llc
Purchase Details
Closed on
Sep 18, 2002
Sold by
Conseco Credit Corp and Green Tree Credit Corp
Bought by
Candino Christopher
Purchase Details
Closed on
Feb 14, 1995
Sold by
Stoklosa Daniel P and Stoklosa Suzanne
Bought by
Sava Frank and Sava Robin
Create a Home Valuation Report for This Property
The Home Valuation Report is an in-depth analysis detailing your home's value as well as a comparison with similar homes in the area
Home Values in the Area
Average Home Value in this Area
Purchase History
| Date | Buyer | Sale Price | Title Company |
|---|---|---|---|
| Elliott Rose Real Estate Holdings Llc | $949,522 | None Available | |
| Elliott Rose Real Estate Holdings Llc | $949,522 | None Available | |
| Bricks & Mortar Properties Llc | -- | None Available | |
| Bricks & Mortar Properties Llc | -- | None Available | |
| Autonomous Development Llc | -- | None Available | |
| Autonomous Development Llc | -- | None Available | |
| Candino Christopher | $42,500 | Fidelity National Title Ins | |
| Candino Christopher | $42,500 | Fidelity National Title Ins | |
| Sava Frank | $92,500 | -- | |
| Sava Frank | $92,500 | -- |
Source: Public Records
Tax History Compared to Growth
Tax History
| Year | Tax Paid | Tax Assessment Tax Assessment Total Assessment is a certain percentage of the fair market value that is determined by local assessors to be the total taxable value of land and additions on the property. | Land | Improvement |
|---|---|---|---|---|
| 2024 | -- | $40,000 | $6,400 | $33,600 |
| 2023 | $6,102 | $40,000 | $6,400 | $33,600 |
| 2022 | $5,371 | $40,000 | $6,400 | $33,600 |
| 2021 | $3,299 | $40,000 | $6,400 | $33,600 |
| 2020 | $4,736 | $40,000 | $6,400 | $33,600 |
| 2019 | $2,718 | $40,000 | $6,400 | $33,600 |
| 2018 | $4,150 | $40,000 | $6,400 | $33,600 |
| 2017 | $2,718 | $40,000 | $6,400 | $33,600 |
| 2016 | $3,941 | $40,000 | $6,400 | $33,600 |
| 2015 | -- | $40,000 | $6,400 | $33,600 |
| 2014 | -- | $40,000 | $6,400 | $33,600 |
Source: Public Records
Map
Nearby Homes
- 78 Tremaine Ave
- 130 W Hazeltine Ave
- 129 Tremaine Ave
- 76 Mang Ave
- 153 Hinman Ave
- 32 E Hazeltine Ave
- 175 W Hazeltine Ave
- 184 Lasalle Ave
- 67 E Hazeltine Ave
- 63 Euclid Ave
- 212 Hinman Ave
- 120 Victoria Blvd
- 1275 Kenmore Ave
- 1244 Kenmore Ave
- 121 Hartwell Rd
- 41 Hartwell Rd
- 228 Hartwell Rd
- 194 Westgate Rd
- 115 Stratford Rd
- 29 Avery Ave
- 66 W Hazeltine Ave
- 56 W Hazeltine Ave
- 54 W Hazeltine Ave
- 68 W Hazeltine Ave
- 50 W Hazeltine Ave
- 70 W Hazeltine Ave
- 1455 Kenmore Ave
- 1459 Kenmore Ave
- 46 W Hazeltine Ave
- 72 W Hazeltine Ave
- 1449 Kenmore Ave
- 1445 Kenmore Ave
- 44 W Hazeltine Ave
- 1465 Kenmore Ave
- 76 W Hazeltine Ave
- 63 W Hazeltine Ave
- 55 W Hazeltine Ave
- 55 W Hazeltine Ave Unit UPPER
- 1443 Kenmore Ave
- 65 W Hazeltine Ave