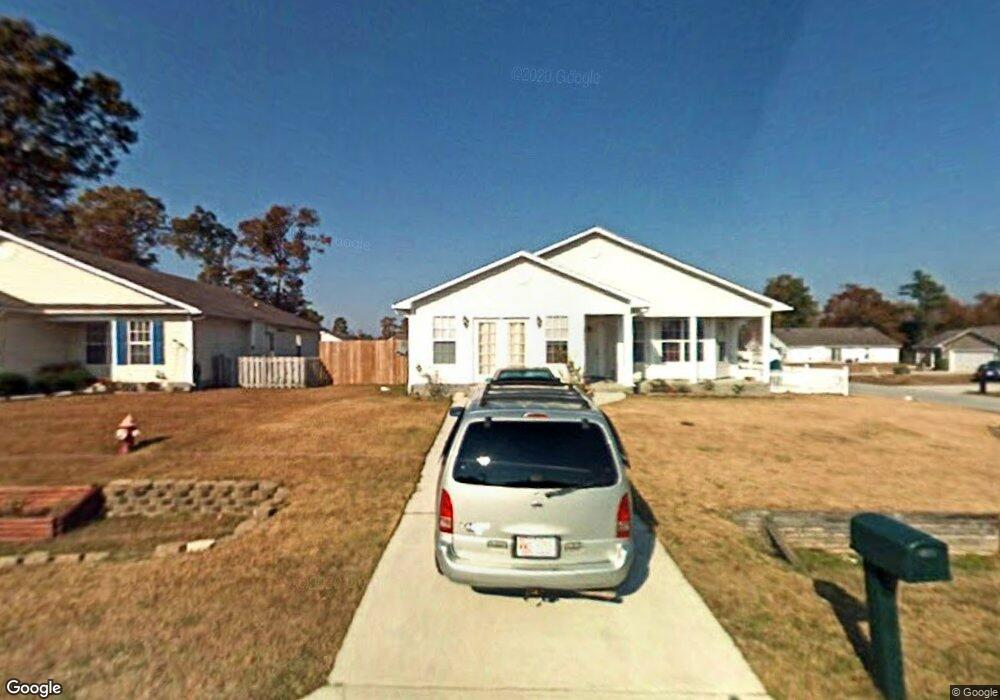
600 Raspberry Ct Hubert, NC 28539
Hubert NeighborhoodEstimated Value: $275,000 - $303,000
4
Beds
2
Baths
1,924
Sq Ft
$153/Sq Ft
Est. Value
About This Home
This home is located at 600 Raspberry Ct, Hubert, NC 28539 and is currently estimated at $293,924, approximately $152 per square foot. 600 Raspberry Ct is a home located in Onslow County with nearby schools including Queens Creek Elementary School, Swansboro Middle School, and Swansboro High School.
Ownership History
Date
Name
Owned For
Owner Type
Purchase Details
Closed on
Dec 5, 2011
Sold by
Beneficial Financial I
Bought by
Parker Kim M and Parker Robin
Current Estimated Value
Home Financials for this Owner
Home Financials are based on the most recent Mortgage that was taken out on this home.
Original Mortgage
$137,900
Outstanding Balance
$94,559
Interest Rate
4.06%
Mortgage Type
VA
Estimated Equity
$199,365
Purchase Details
Closed on
Jul 27, 2006
Sold by
Fantini Peter V and Fantini Angela S
Bought by
Galvan Jose J and Galvan Noemi
Home Financials for this Owner
Home Financials are based on the most recent Mortgage that was taken out on this home.
Original Mortgage
$150,220
Interest Rate
6.68%
Mortgage Type
Purchase Money Mortgage
Purchase Details
Closed on
Feb 28, 2005
Sold by
Perez Maria T and Perez Reynaldo
Bought by
Fantini Peter V and Fantini Angela S
Home Financials for this Owner
Home Financials are based on the most recent Mortgage that was taken out on this home.
Original Mortgage
$122,580
Interest Rate
5.6%
Mortgage Type
VA
Create a Home Valuation Report for This Property
The Home Valuation Report is an in-depth analysis detailing your home's value as well as a comparison with similar homes in the area
Home Values in the Area
Average Home Value in this Area
Purchase History
| Date | Buyer | Sale Price | Title Company |
|---|---|---|---|
| Parker Kim M | $135,000 | None Available | |
| Galvan Jose J | $148,000 | None Available | |
| Fantini Peter V | $120,000 | Chicago Title Insurance Co |
Source: Public Records
Mortgage History
| Date | Status | Borrower | Loan Amount |
|---|---|---|---|
| Open | Parker Kim M | $137,900 | |
| Previous Owner | Galvan Jose J | $150,220 | |
| Previous Owner | Fantini Peter V | $122,580 |
Source: Public Records
Tax History
| Year | Tax Paid | Tax Assessment Tax Assessment Total Assessment is a certain percentage of the fair market value that is determined by local assessors to be the total taxable value of land and additions on the property. | Land | Improvement |
|---|---|---|---|---|
| 2025 | $1,373 | $209,545 | $40,000 | $169,545 |
| 2024 | $1,373 | $209,545 | $40,000 | $169,545 |
| 2023 | $1,373 | $209,545 | $40,000 | $169,545 |
| 2022 | $1,373 | $209,545 | $40,000 | $169,545 |
| 2021 | $1,036 | $146,960 | $35,000 | $111,960 |
| 2020 | $1,036 | $146,960 | $35,000 | $111,960 |
| 2019 | $1,036 | $146,960 | $35,000 | $111,960 |
| 2018 | $1,036 | $146,960 | $35,000 | $111,960 |
| 2017 | $980 | $145,150 | $40,000 | $105,150 |
| 2016 | $980 | $145,150 | $0 | $0 |
| 2015 | $980 | $145,150 | $0 | $0 |
| 2014 | $980 | $145,150 | $0 | $0 |
Source: Public Records
Map
Nearby Homes
- 424 Boysenberry Ln
- 201 Blueberry Ct
- 407 Sundown Ct
- 205 Mango Place S
- 305 Tassel Ct
- 207 Portland Place
- 209 Middle Ridge Dr
- 115 Trailwood Dr
- 105 Gillcrest Ln
- 226 Middle Ridge Dr
- 104 Trailwood Dr
- 206 Hominy Ct
- 406 Silverstone Place
- 301 Cotton Hill Place Unit Lot 89
- 415 Windermere Rd
- 417 Windermere Rd
- 305 Cotton Hill Place
- 414 Windermere Rd
- 309 Cotton Hill Place Unit Lot 91
- 429 Windermere Rd
- 602 Raspberry Ct
- 604 Raspberry Ct
- 501 Blackberry Ct
- 417 Boysenberry Ln
- 421 Boysenberry Ln
- 503 Blackberry Ct
- 419 Boysenberry Ln
- 606 Raspberry Ct
- 505 Blackberry Ct
- 425 Boysenberry Ln
- 601 Raspberry Ct
- 603 Raspberry Ct
- 507 Blackberry Ct
- 605 Raspberry Ct
- 427 Boysenberry Ln
- 415 Boysenberry Ln
- 607 Raspberry Ct
- 610 Raspberry Ct
- 509 Blackberry Ct
- 429 Boysenberry Ln
Your Personal Tour Guide
Ask me questions while you tour the home.