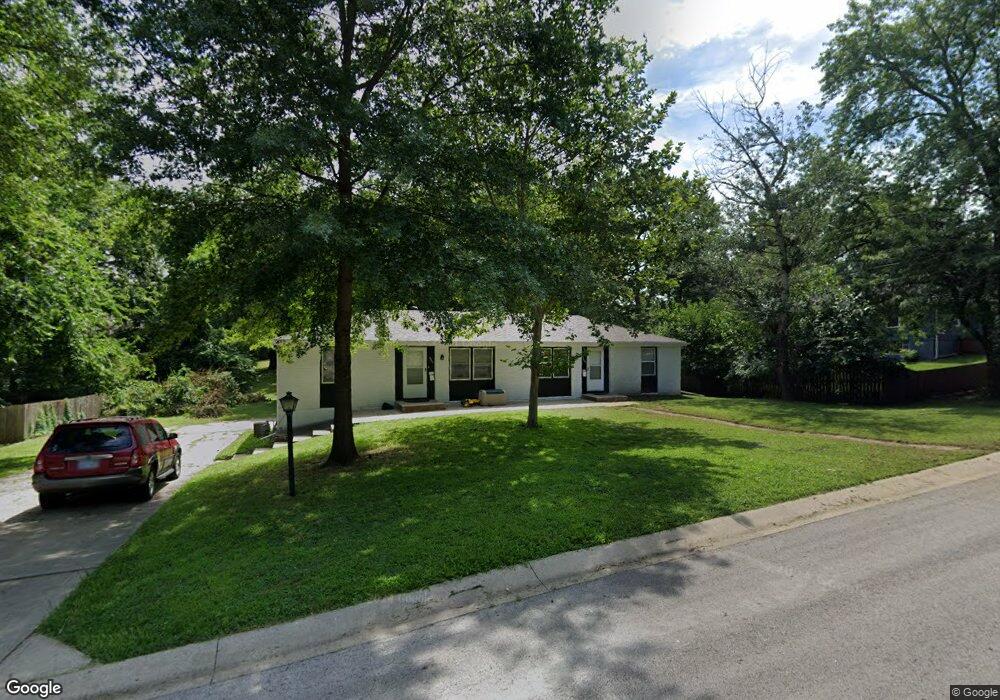
6001 W Richards Dr Shawnee, KS 66216
Estimated Value: $299,000 - $336,000
4
Beds
4
Baths
1,440
Sq Ft
$224/Sq Ft
Est. Value
About This Home
This home is located at 6001 W Richards Dr, Shawnee, KS 66216 and is currently estimated at $322,573, approximately $224 per square foot. 6001 W Richards Dr is a home located in Johnson County with nearby schools including Ray Marsh Elementary School, Trailridge Middle School, and Shawnee Mission Northwest High School.
Ownership History
Date
Name
Owned For
Owner Type
Purchase Details
Closed on
May 26, 2023
Sold by
Frohling Phillip M and Frohling Cynthia R
Bought by
Frohling Revocable Trust
Current Estimated Value
Purchase Details
Closed on
Jul 23, 2021
Sold by
Mccann James M and Mccann Vanessa F
Bought by
Frohling Phillip and Frohling Cynthia
Home Financials for this Owner
Home Financials are based on the most recent Mortgage that was taken out on this home.
Original Mortgage
$175,500
Interest Rate
2.93%
Mortgage Type
New Conventional
Purchase Details
Closed on
Aug 26, 2006
Sold by
Sloan Elizabeth F and Sloan Hershel F
Bought by
Anderson Robert
Home Financials for this Owner
Home Financials are based on the most recent Mortgage that was taken out on this home.
Original Mortgage
$124,000
Interest Rate
6.79%
Mortgage Type
New Conventional
Create a Home Valuation Report for This Property
The Home Valuation Report is an in-depth analysis detailing your home's value as well as a comparison with similar homes in the area
Home Values in the Area
Average Home Value in this Area
Purchase History
| Date | Buyer | Sale Price | Title Company |
|---|---|---|---|
| Frohling Revocable Trust | -- | None Listed On Document | |
| Frohling Phillip | -- | Platinum Title Llc | |
| Anderson Robert | -- | Kansas City Title |
Source: Public Records
Mortgage History
| Date | Status | Borrower | Loan Amount |
|---|---|---|---|
| Previous Owner | Frohling Phillip | $175,500 | |
| Previous Owner | Anderson Robert | $124,000 |
Source: Public Records
Tax History Compared to Growth
Tax History
| Year | Tax Paid | Tax Assessment Tax Assessment Total Assessment is a certain percentage of the fair market value that is determined by local assessors to be the total taxable value of land and additions on the property. | Land | Improvement |
|---|---|---|---|---|
| 2024 | $3,399 | $31,636 | $5,866 | $25,770 |
| 2023 | $3,297 | $30,130 | $5,866 | $24,264 |
| 2022 | $2,950 | $26,795 | $5,405 | $21,390 |
| 2021 | $2,950 | $22,207 | $4,699 | $17,508 |
| 2020 | $2,515 | $20,953 | $4,265 | $16,688 |
| 2019 | $2,477 | $20,620 | $3,219 | $17,401 |
| 2018 | $2,451 | $19,366 | $2,901 | $16,465 |
| 2017 | $2,224 | $17,135 | $2,901 | $14,234 |
| 2016 | $1,991 | $15,893 | $2,901 | $12,992 |
| 2015 | $1,821 | $15,456 | $2,901 | $12,555 |
| 2013 | -- | $14,605 | $2,901 | $11,704 |
Source: Public Records
Map
Nearby Homes
- 4908 Noland Rd
- 5807 Noland Rd
- 5919 Pflumm Rd
- 12809 W 57th Terrace
- 6143 Park St
- 6145 Park St
- 5845 Caenen St
- 5703 Cottonwood St
- 5507 Noland Rd
- 12116 W 63rd Terrace
- 5620 Monrovia St
- 12508 W 56th St
- 12225 W 64th Terrace
- 5530 Rene St
- 5713 Widmer Rd
- 13415 W 66th Terrace
- 14204 W 63rd St
- 12914 W 67th St
- 5504 Monrovia St
- 14214 W 63rd St
- 5933 W Richards Dr
- 6013 W Richards Dr
- 6002 E Richards Dr
- 5929 W Richards Dr
- 5954 E Richards Dr
- 6010 E Richards Dr
- 6000 W Richards Dr
- 5934 W Richards Dr
- 5950 E Richards Dr
- 6008 W Richards Dr
- 6012 W Richards Dr
- 5925 W Richards Dr
- 5930 W Richards Dr
- 6011 E Richards Dr
- 5946 E Richards Dr
- 6014 W Richards Dr
- 5926 W Richards Dr
- 6001 E Richards Dr
- 6003 Noland Rd
- 6001 Noland Rd