6012 S Garland Way Littleton, CO 80123
Kipling Hills NeighborhoodEstimated Value: $506,790 - $562,000
3
Beds
1
Bath
989
Sq Ft
$539/Sq Ft
Est. Value
About This Home
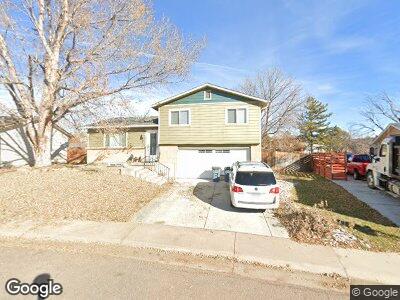
This home is located at 6012 S Garland Way, Littleton, CO 80123 and is currently estimated at $533,198, approximately $539 per square foot. 6012 S Garland Way is a home located in Jefferson County with nearby schools including Powderhorn Elementary School, Summit Ridge Middle School, and Dakota Ridge Senior High School.
Ownership History
Date
Name
Owned For
Owner Type
Purchase Details
Closed on
Jul 8, 2015
Sold by
Page Charles A and Page Gina M
Bought by
Page Charles A
Current Estimated Value
Home Financials for this Owner
Home Financials are based on the most recent Mortgage that was taken out on this home.
Original Mortgage
$205,000
Interest Rate
4.08%
Mortgage Type
New Conventional
Purchase Details
Closed on
Oct 15, 1999
Sold by
Porter Mark W
Bought by
Page Charles A and Page Gina M
Home Financials for this Owner
Home Financials are based on the most recent Mortgage that was taken out on this home.
Original Mortgage
$146,023
Interest Rate
7.86%
Mortgage Type
FHA
Purchase Details
Closed on
Mar 31, 1994
Sold by
Porter Mark W and Porter Sheryl Ann
Bought by
Porter Mark W
Create a Home Valuation Report for This Property
The Home Valuation Report is an in-depth analysis detailing your home's value as well as a comparison with similar homes in the area
Home Values in the Area
Average Home Value in this Area
Purchase History
| Date | Buyer | Sale Price | Title Company |
|---|---|---|---|
| Page Charles A | -- | None Available | |
| Page Charles A | $147,000 | North American Title Co | |
| Porter Mark W | -- | -- |
Source: Public Records
Mortgage History
| Date | Status | Borrower | Loan Amount |
|---|---|---|---|
| Open | Page Charles A | $165,000 | |
| Open | Page Charles A | $343,500 | |
| Closed | Page Charles | $39,224 | |
| Closed | Page Charles A | $304,500 | |
| Closed | Page Charles A | $304,436 | |
| Closed | Page Charles A | $260,000 | |
| Closed | Page Charles A | $216,000 | |
| Closed | Page Charles A | $205,000 | |
| Closed | Page Charles A | $207,570 | |
| Closed | Page Charles A | $172,000 | |
| Closed | Page Charles A | $43,000 | |
| Closed | Page Charles A | $47,367 | |
| Closed | Page Charles A | $25,000 | |
| Closed | Page Charles A | $166,451 | |
| Closed | Page Charles A | $146,023 | |
| Previous Owner | Porter Mark W | $81,200 |
Source: Public Records
Tax History Compared to Growth
Tax History
| Year | Tax Paid | Tax Assessment Tax Assessment Total Assessment is a certain percentage of the fair market value that is determined by local assessors to be the total taxable value of land and additions on the property. | Land | Improvement |
|---|---|---|---|---|
| 2024 | $3,033 | $28,519 | $11,138 | $17,381 |
| 2023 | $3,033 | $28,519 | $11,138 | $17,381 |
| 2022 | $2,780 | $25,700 | $9,472 | $16,228 |
| 2021 | $2,819 | $26,439 | $9,744 | $16,695 |
| 2020 | $2,469 | $23,078 | $7,552 | $15,526 |
| 2019 | $2,437 | $23,078 | $7,552 | $15,526 |
| 2018 | $2,215 | $20,195 | $7,550 | $12,645 |
| 2017 | $2,038 | $20,195 | $7,550 | $12,645 |
| 2016 | $1,723 | $16,384 | $5,980 | $10,404 |
| 2015 | $1,461 | $16,384 | $5,980 | $10,404 |
| 2014 | $1,461 | $12,925 | $5,053 | $7,872 |
Source: Public Records
Map
Nearby Homes
- 6010 S Garland Way
- 9340 W Burgundy Ave
- 9379 W Burgundy Ave
- 9565 W Lake Place
- 9562 W Capri Dr
- 9135 W Maplewood Ave
- 5960 S Jellison St Unit B
- 5976 S Jellison St Unit E
- 5926 S Jellison St Unit B
- 9684 W Long Dr
- 6141 S Estes St
- 5723 S Everett Way
- 6074 S Dudley Way
- 9731 W Polk Dr
- 10064 W Lake Dr
- 8732 W Arbor Ave
- 10102 W Ida Ave Unit 214
- 6393 S Johnson St
- 5454 S Everett Ct
- 10262 W Ida Ave Unit 243
- 6012 S Garland Way
- 6014 S Garland Way
- 6008 S Garland Way
- 6016 S Garland Way
- 9360 W Burgundy Ave
- 6011 S Garland Way
- 6015 S Garland Way
- 9320 W Burgundy Ave
- 9380 W Burgundy Ave
- 6009 S Garland Way
- 6006 S Garland Way
- 6018 S Garland Way
- 9400 W Burgundy Ave
- 6007 S Garland Way
- 9309 W Lake Dr
- 9319 W Lake Dr
- 6004 S Garland Way
- 9329 W Lake Dr
- 6020 S Garland Way
- 9410 W Burgundy Ave