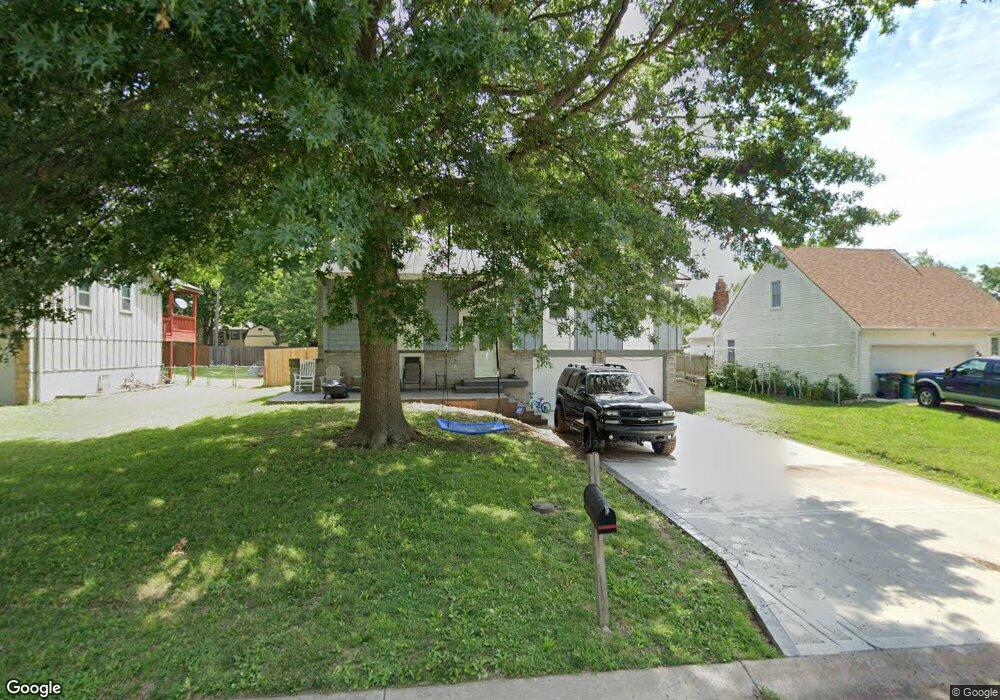
6017 Haskins St Shawnee, KS 66216
Estimated Value: $290,000 - $334,000
3
Beds
2
Baths
1,137
Sq Ft
$274/Sq Ft
Est. Value
About This Home
This home is located at 6017 Haskins St, Shawnee, KS 66216 and is currently estimated at $311,856, approximately $274 per square foot. 6017 Haskins St is a home located in Johnson County with nearby schools including Ray Marsh Elementary School, Trailridge Middle School, and Shawnee Mission Northwest High School.
Ownership History
Date
Name
Owned For
Owner Type
Purchase Details
Closed on
Jan 21, 2008
Sold by
Lazenby Brandin M and Lazenby Natalie D
Bought by
Lopez Rios Jorge R and Lopez Rios Stacie
Current Estimated Value
Home Financials for this Owner
Home Financials are based on the most recent Mortgage that was taken out on this home.
Original Mortgage
$150,588
Outstanding Balance
$94,806
Interest Rate
6.11%
Mortgage Type
New Conventional
Estimated Equity
$217,050
Purchase Details
Closed on
Dec 29, 2005
Sold by
Thomas Proerties Llc
Bought by
Lazenby Brandin M
Home Financials for this Owner
Home Financials are based on the most recent Mortgage that was taken out on this home.
Original Mortgage
$110,400
Interest Rate
6.23%
Mortgage Type
New Conventional
Purchase Details
Closed on
Nov 11, 2003
Sold by
Simmons Rita A
Bought by
Thomas Properties Llc
Home Financials for this Owner
Home Financials are based on the most recent Mortgage that was taken out on this home.
Original Mortgage
$98,400
Interest Rate
5.81%
Mortgage Type
Purchase Money Mortgage
Create a Home Valuation Report for This Property
The Home Valuation Report is an in-depth analysis detailing your home's value as well as a comparison with similar homes in the area
Home Values in the Area
Average Home Value in this Area
Purchase History
| Date | Buyer | Sale Price | Title Company |
|---|---|---|---|
| Lopez Rios Jorge R | -- | Chicago Title Ins Co | |
| Lazenby Brandin M | -- | Chicago Title Insurance Co | |
| Thomas Properties Llc | -- | Security Land Title Company |
Source: Public Records
Mortgage History
| Date | Status | Borrower | Loan Amount |
|---|---|---|---|
| Open | Lopez Rios Jorge R | $150,588 | |
| Previous Owner | Lazenby Brandin M | $110,400 | |
| Previous Owner | Thomas Properties Llc | $98,400 |
Source: Public Records
Tax History Compared to Growth
Tax History
| Year | Tax Paid | Tax Assessment Tax Assessment Total Assessment is a certain percentage of the fair market value that is determined by local assessors to be the total taxable value of land and additions on the property. | Land | Improvement |
|---|---|---|---|---|
| 2024 | $3,194 | $30,407 | $6,176 | $24,231 |
| 2023 | $3,068 | $28,669 | $5,875 | $22,794 |
| 2022 | $2,780 | $25,887 | $5,341 | $20,546 |
| 2021 | $2,730 | $23,747 | $4,856 | $18,891 |
| 2020 | $2,530 | $21,712 | $4,413 | $17,299 |
| 2019 | $2,332 | $19,987 | $4,008 | $15,979 |
| 2018 | $2,121 | $19,458 | $4,008 | $15,450 |
| 2017 | $2,165 | $18,181 | $3,505 | $14,676 |
| 2016 | $2,114 | $17,526 | $3,505 | $14,021 |
| 2015 | $1,963 | $16,985 | $3,505 | $13,480 |
| 2013 | -- | $16,284 | $3,505 | $12,779 |
Source: Public Records
Map
Nearby Homes
- 4908 Noland Rd
- 5919 Pflumm Rd
- 5807 Noland Rd
- 6143 Park St
- 6145 Park St
- 12809 W 57th Terrace
- 5703 Cottonwood St
- 14204 W 63rd St
- 14214 W 63rd St
- 5713 Widmer Rd
- 5845 Caenen St
- 5507 Noland Rd
- 5530 Rene St
- 13415 W 66th Terrace
- 6640 Pflumm Rd
- 12914 W 67th St
- 12116 W 63rd Terrace
- 12225 W 64th Terrace
- 12508 W 56th St
- 5620 Monrovia St