Estimated Value: $220,368 - $240,000
3
Beds
2
Baths
1,467
Sq Ft
$158/Sq Ft
Est. Value
About This Home
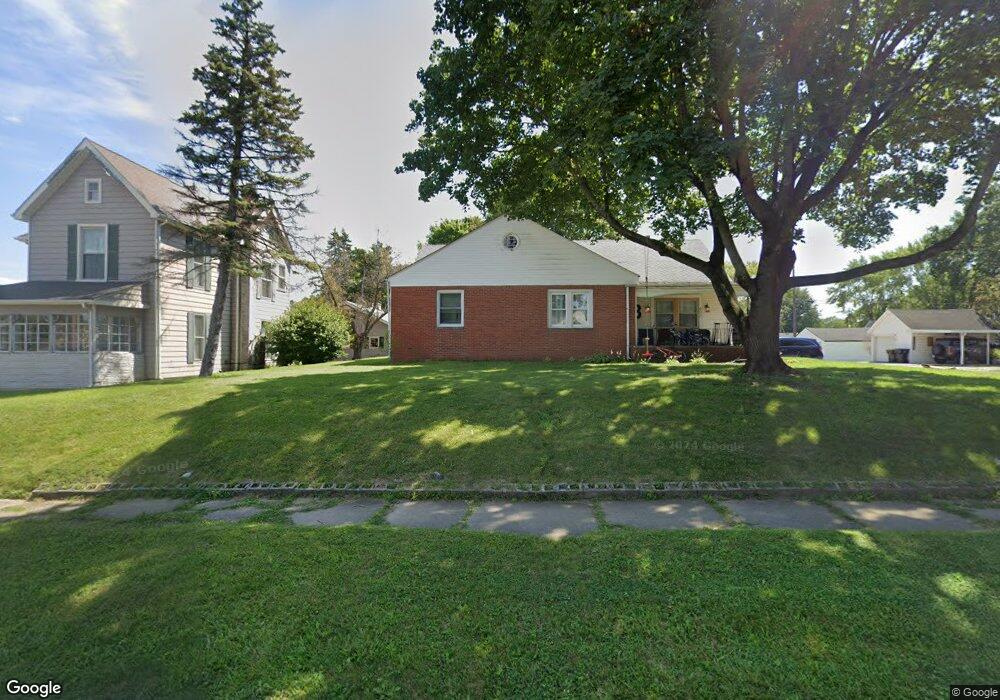
This home is located at 602 S Woodward St, Lapel, IN 46051 and is currently estimated at $231,592, approximately $157 per square foot. 602 S Woodward St is a home with nearby schools including Lapel Elementary School, Lapel Middle School, and Lapel Senior High School.
Ownership History
Date
Name
Owned For
Owner Type
Purchase Details
Closed on
Nov 21, 2014
Sold by
Closser Stephanie L
Bought by
Berry Stephen R and Berry Leah
Current Estimated Value
Home Financials for this Owner
Home Financials are based on the most recent Mortgage that was taken out on this home.
Original Mortgage
$110,204
Outstanding Balance
$83,645
Interest Rate
3.91%
Mortgage Type
Stand Alone First
Estimated Equity
$147,947
Purchase Details
Closed on
Nov 23, 2010
Sold by
Crawley Stephanie L and Closser Stephanie Leigh
Bought by
Cosser Stephanie L
Purchase Details
Closed on
Jun 28, 2007
Sold by
Dickerson Jessie L and Dickerson Neal F
Bought by
Crawley Chad E and Crawley Stephanie L
Home Financials for this Owner
Home Financials are based on the most recent Mortgage that was taken out on this home.
Original Mortgage
$97,500
Interest Rate
6.37%
Mortgage Type
New Conventional
Create a Home Valuation Report for This Property
The Home Valuation Report is an in-depth analysis detailing your home's value as well as a comparison with similar homes in the area
Home Values in the Area
Average Home Value in this Area
Purchase History
| Date | Buyer | Sale Price | Title Company |
|---|---|---|---|
| Berry Stephen R | -- | -- | |
| Cosser Stephanie L | -- | None Available | |
| Crawley Chad E | -- | -- |
Source: Public Records
Mortgage History
| Date | Status | Borrower | Loan Amount |
|---|---|---|---|
| Open | Berry Stephen R | $110,204 | |
| Previous Owner | Crawley Chad E | $97,500 |
Source: Public Records
Tax History Compared to Growth
Tax History
| Year | Tax Paid | Tax Assessment Tax Assessment Total Assessment is a certain percentage of the fair market value that is determined by local assessors to be the total taxable value of land and additions on the property. | Land | Improvement |
|---|---|---|---|---|
| 2025 | $1,287 | $128,700 | $14,600 | $114,100 |
| 2024 | $1,287 | $128,700 | $14,600 | $114,100 |
| 2023 | $1,177 | $117,700 | $13,900 | $103,800 |
| 2022 | $1,175 | $117,500 | $13,200 | $104,300 |
| 2021 | $1,082 | $108,200 | $13,200 | $95,000 |
| 2020 | $1,027 | $102,700 | $12,500 | $90,200 |
| 2019 | $1,000 | $100,000 | $12,500 | $87,500 |
| 2018 | $919 | $91,900 | $12,500 | $79,400 |
| 2017 | $908 | $90,800 | $12,500 | $78,300 |
| 2016 | $908 | $90,800 | $12,500 | $78,300 |
| 2014 | $1,080 | $100,200 | $12,500 | $87,700 |
| 2013 | $1,080 | $100,200 | $12,500 | $87,700 |
Source: Public Records
Map
Nearby Homes
- 614 S Woodward St
- 108 W 5th St
- 0 Vine St
- 1019 N John St
- Aspen II Plan at Tuscany
- Spruce Plan at Tuscany
- Norway Plan at Tuscany
- Chestnut Plan at Tuscany
- Ashton Plan at Tuscany
- Juniper Plan at Tuscany
- Ironwood Plan at Tuscany
- Palmetto Plan at Tuscany
- Empress Plan at Tuscany
- Bradford Plan at Tuscany
- Cooper Plan at Tuscany
- 223 W 9th St
- 223 W 11th St
- 3110 Montgomery Blvd
- 9417 Crimson Cir
- Arlington Plan at Montgomery Farms
- 530 S Woodward St
- 603 S Woodward St
- 615 S John St
- 603 John St
- 615 S Woodward St
- 531 S Woodward St
- 101 E 7th St
- 625 S Woodward St
- 523 S Woodward St
- 605 S Woodward St
- 525 S John St
- 129 E 7th St
- 635 S Woodward St
- 106 E Pendleton Ave
- 6 E Pendleton Ave
- 124 E 5th St
- 102 E 7th St
- 530 S John St
- 118 E 7th St
- 114 E 7th St