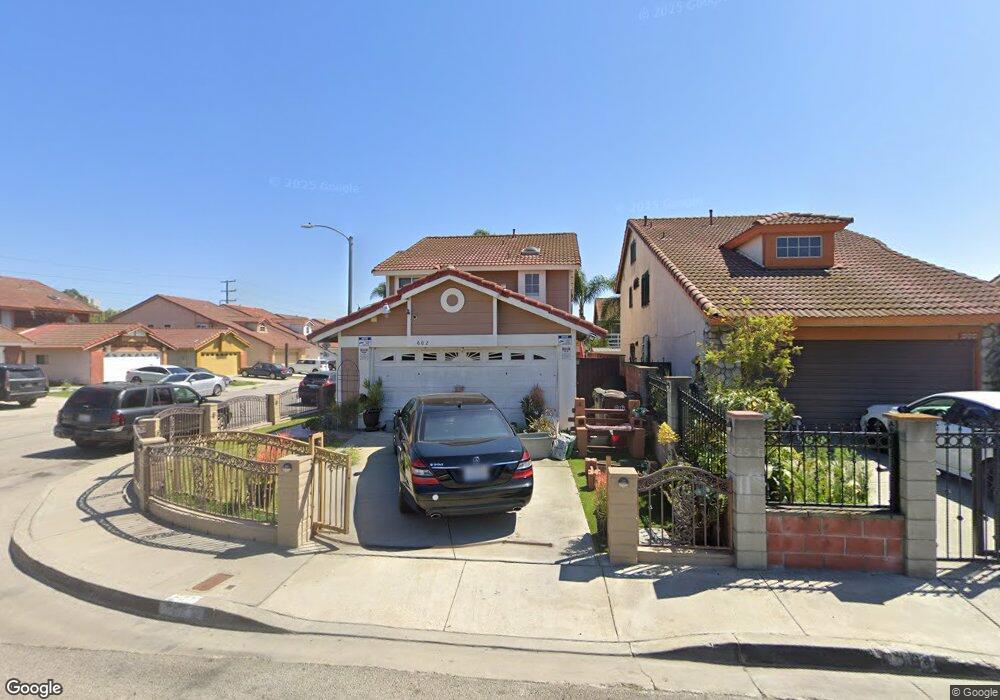
602 W Palm Cir Compton, CA 90220
Estimated Value: $584,000 - $661,000
3
Beds
2
Baths
1,398
Sq Ft
$443/Sq Ft
Est. Value
About This Home
This home is located at 602 W Palm Cir, Compton, CA 90220 and is currently estimated at $618,651, approximately $442 per square foot. 602 W Palm Cir is a home located in Los Angeles County with nearby schools including Longfellow Elementary School, Benjamin O. Davis Middle School, and Compton High School.
Ownership History
Date
Name
Owned For
Owner Type
Purchase Details
Closed on
Nov 29, 2022
Sold by
Williams Lori Ann
Bought by
Lori Ann Williams Living Trust
Current Estimated Value
Home Financials for this Owner
Home Financials are based on the most recent Mortgage that was taken out on this home.
Original Mortgage
$254,900
Outstanding Balance
$246,996
Interest Rate
6.95%
Mortgage Type
New Conventional
Estimated Equity
$371,655
Purchase Details
Closed on
Apr 10, 1998
Sold by
Garcia Celso and Garcia Ma Socorro
Bought by
Williams Lori A
Home Financials for this Owner
Home Financials are based on the most recent Mortgage that was taken out on this home.
Original Mortgage
$126,023
Interest Rate
7.06%
Mortgage Type
FHA
Create a Home Valuation Report for This Property
The Home Valuation Report is an in-depth analysis detailing your home's value as well as a comparison with similar homes in the area
Home Values in the Area
Average Home Value in this Area
Purchase History
| Date | Buyer | Sale Price | Title Company |
|---|---|---|---|
| Lori Ann Williams Living Trust | -- | Accommodation/Courtesy Recordi | |
| Williams Lori Ann | -- | Stewart Title | |
| Williams Lori A | $127,000 | Fidelity Title |
Source: Public Records
Mortgage History
| Date | Status | Borrower | Loan Amount |
|---|---|---|---|
| Open | Williams Lori Ann | $254,900 | |
| Previous Owner | Williams Lori A | $126,023 |
Source: Public Records
Tax History
| Year | Tax Paid | Tax Assessment Tax Assessment Total Assessment is a certain percentage of the fair market value that is determined by local assessors to be the total taxable value of land and additions on the property. | Land | Improvement |
|---|---|---|---|---|
| 2025 | $3,952 | $199,071 | $78,999 | $120,072 |
| 2024 | $3,952 | $195,168 | $77,450 | $117,718 |
| 2023 | $3,893 | $191,342 | $75,932 | $115,410 |
| 2022 | $5,625 | $187,592 | $74,444 | $113,148 |
| 2021 | $5,648 | $183,915 | $72,985 | $110,930 |
| 2020 | $5,591 | $182,030 | $72,237 | $109,793 |
| 2019 | $5,551 | $178,462 | $70,821 | $107,641 |
| 2018 | $5,435 | $174,964 | $69,433 | $105,531 |
| 2016 | $5,273 | $168,172 | $66,738 | $101,434 |
| 2015 | $2,885 | $165,647 | $65,736 | $99,911 |
| 2014 | $2,835 | $162,403 | $64,449 | $97,954 |
Source: Public Records
Map
Nearby Homes
- 310 S Paulsen Ave
- 533 W Almond St
- 653 W Compton Blvd
- 524 W Laurel St
- 623 W Indigo St
- 115 N Magnolia Ct
- 159 S Wilmington Ave Unit F
- 157 S Wilmington Ave Unit I
- 155 S Wilmington Ave Unit C
- 435 W Almond St
- 427 W Laurel St
- 820 W Compton Blvd Unit 17
- 426 W Laurel St
- 640 W Palmer St
- 436 W Magnolia St
- 409 W Almond St
- 531 W Palmer St
- 969 W Dhalia St
- 910 W Palmer St
- 485 W Compton Blvd
- 604 W Palm Cir
- 606 W Palm Cir
- 608 W Palm Cir
- 601 W Almond St
- 603 W Almond St
- 609 W Almond St
- 258 S Sherer Place
- 260 S Sherer Place
- 252 S Sherer Place
- 268 S Sherer Place
- 611 W Almond St
- 248 S Sherer Place
- 610 W Palm Cir
- 272 S Sherer Place
- 601 W Palm Cir
- 605 W Palm Cir
- 244 S Sherer Place
- 617 W Almond St
- 612 W Palm Cir
- 278 S Sherer Place
Your Personal Tour Guide
Ask me questions while you tour the home.