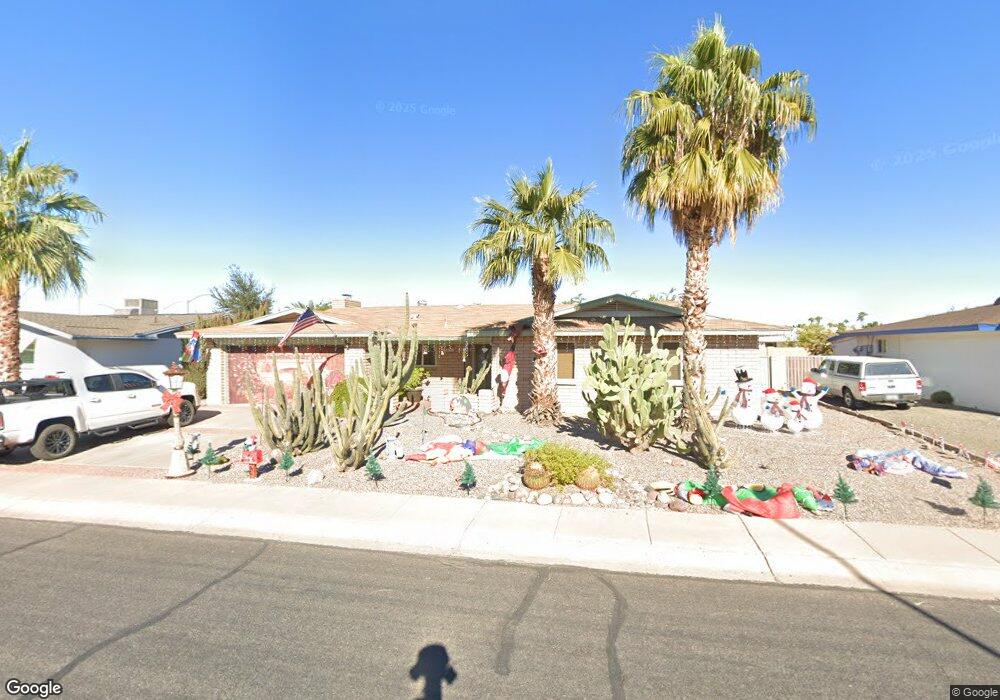
6026 E Duncan St Mesa, AZ 85205
Central Mesa East NeighborhoodEstimated Value: $358,970 - $417,000
3
Beds
2
Baths
2,010
Sq Ft
$197/Sq Ft
Est. Value
About This Home
This home is located at 6026 E Duncan St, Mesa, AZ 85205 and is currently estimated at $395,743, approximately $196 per square foot. 6026 E Duncan St is a home located in Maricopa County with nearby schools including Salk Elementary School, Franklin at Brimhall Elementary School, and Franklin West Elementary School.
Ownership History
Date
Name
Owned For
Owner Type
Purchase Details
Closed on
Feb 18, 2026
Sold by
Watmore Jean
Bought by
Green David and Watmore Jean
Current Estimated Value
Purchase Details
Closed on
Mar 2, 2017
Sold by
Schultz Norma J and Wilson Gena A
Bought by
Watmore Steven M and Watmore Jean M
Home Financials for this Owner
Home Financials are based on the most recent Mortgage that was taken out on this home.
Original Mortgage
$250,381
Interest Rate
4.25%
Mortgage Type
FHA
Purchase Details
Closed on
Jun 7, 2005
Sold by
Ohaver Marguerite M
Bought by
Schultz Norma J and Wilson Gena A
Home Financials for this Owner
Home Financials are based on the most recent Mortgage that was taken out on this home.
Original Mortgage
$117,000
Interest Rate
5.72%
Mortgage Type
New Conventional
Purchase Details
Closed on
Nov 12, 1999
Sold by
Ohaver Marguerite M
Bought by
Ohaver Marguerite M and Marguerite M Ohaver Revocable Trust
Create a Home Valuation Report for This Property
The Home Valuation Report is an in-depth analysis detailing your home's value as well as a comparison with similar homes in the area
Home Values in the Area
Average Home Value in this Area
Purchase History
| Date | Buyer | Sale Price | Title Company |
|---|---|---|---|
| Green David | -- | None Listed On Document | |
| Watmore Steven M | $25,000 | First American Title Insuran | |
| Schultz Norma J | $201,000 | Transnation Title | |
| Ohaver Marguerite M | -- | -- |
Source: Public Records
Mortgage History
| Date | Status | Borrower | Loan Amount |
|---|---|---|---|
| Previous Owner | Watmore Steven M | $250,381 | |
| Previous Owner | Schultz Norma J | $117,000 |
Source: Public Records
Tax History
| Year | Tax Paid | Tax Assessment Tax Assessment Total Assessment is a certain percentage of the fair market value that is determined by local assessors to be the total taxable value of land and additions on the property. | Land | Improvement |
|---|---|---|---|---|
| 2025 | $1,257 | $16,105 | -- | -- |
| 2024 | $1,303 | $15,338 | -- | -- |
| 2023 | $1,303 | $28,180 | $5,630 | $22,550 |
| 2022 | $1,271 | $21,280 | $4,250 | $17,030 |
| 2021 | $1,285 | $19,480 | $3,890 | $15,590 |
| 2020 | $1,272 | $18,160 | $3,630 | $14,530 |
| 2019 | $1,184 | $16,260 | $3,250 | $13,010 |
| 2018 | $1,148 | $15,380 | $3,070 | $12,310 |
| 2017 | $1,117 | $14,060 | $2,810 | $11,250 |
| 2016 | $1,290 | $13,380 | $2,670 | $10,710 |
| 2015 | $1,020 | $13,320 | $2,660 | $10,660 |
Source: Public Records
Map
Nearby Homes
- 6058 E El Paso St
- 6051 E Ensenada St
- 5915 E Duncan St
- 6037 E Evergreen St
- 5903 E Duncan St
- 5862 E Duncan St
- 6061 E Evergreen St
- 5853 E Adobe Rd
- 864 N 62nd St
- 5829 E Enrose St
- 5822 E Duncan St
- 6218 E Dodge St
- 6231 E Ellis St
- 6222 E El Paso St
- 5856 Colby St
- 5832 Colby St
- 639 N 57th Place
- 1107 N 59th St Unit 5A
- 5704 E Dodge St
- 5901 E Casper Rd
- 6034 E Duncan St
- 6018 E Duncan St
- 6025 E Adobe Rd
- 6033 E Adobe Rd
- 6017 E Adobe Rd
- 6042 E Duncan St
- 6010 E Duncan St
- 6035 E Duncan St
- 6019 E Duncan St
- 6041 E Adobe Rd
- 6009 E Adobe Rd
- 6043 E Duncan St
- 6011 E Duncan St
- 6048 E Duncan St
- 6024 E Dodge St
- 6047 E Adobe Rd
- 6032 E Dodge St
- 6036 E Dodge St
- 6020 E Dodge St
- 6026 E Adobe Rd
Your Personal Tour Guide
Ask me questions while you tour the home.