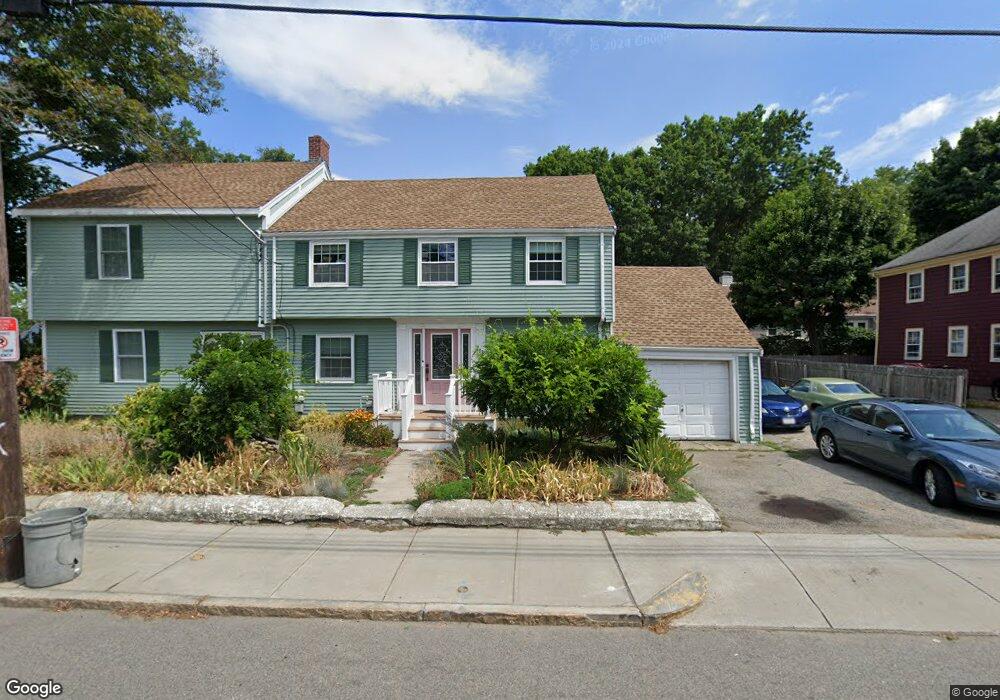
603 Adams St Quincy, MA 02169
West Quincy NeighborhoodEstimated Value: $898,000 - $1,009,000
3
Beds
2
Baths
2,023
Sq Ft
$470/Sq Ft
Est. Value
About This Home
This home is located at 603 Adams St, Quincy, MA 02169 and is currently estimated at $951,194, approximately $470 per square foot. 603 Adams St is a home located in Norfolk County with nearby schools including Charles A. Bernazzani Elementary School, Central Middle School, and North Quincy High School.
Ownership History
Date
Name
Owned For
Owner Type
Purchase Details
Closed on
Feb 7, 2002
Sold by
Nubar Guy
Bought by
Ziegler Richard J and Ziegler Maura E
Current Estimated Value
Home Financials for this Owner
Home Financials are based on the most recent Mortgage that was taken out on this home.
Original Mortgage
$247,500
Outstanding Balance
$102,844
Interest Rate
7.13%
Mortgage Type
Purchase Money Mortgage
Estimated Equity
$848,350
Create a Home Valuation Report for This Property
The Home Valuation Report is an in-depth analysis detailing your home's value as well as a comparison with similar homes in the area
Home Values in the Area
Average Home Value in this Area
Purchase History
| Date | Buyer | Sale Price | Title Company |
|---|---|---|---|
| Ziegler Richard J | $165,000 | -- | |
| Ziegler Richard J | $165,000 | -- |
Source: Public Records
Mortgage History
| Date | Status | Borrower | Loan Amount |
|---|---|---|---|
| Open | Ziegler Richard J | $247,500 |
Source: Public Records
Tax History Compared to Growth
Tax History
| Year | Tax Paid | Tax Assessment Tax Assessment Total Assessment is a certain percentage of the fair market value that is determined by local assessors to be the total taxable value of land and additions on the property. | Land | Improvement |
|---|---|---|---|---|
| 2025 | $9,313 | $807,700 | $281,100 | $526,600 |
| 2024 | $8,691 | $771,200 | $252,900 | $518,300 |
| 2023 | $8,050 | $723,300 | $240,900 | $482,400 |
| 2022 | $7,908 | $660,100 | $192,800 | $467,300 |
| 2021 | $7,756 | $638,900 | $192,800 | $446,100 |
| 2020 | $6,106 | $491,200 | $181,500 | $309,700 |
| 2019 | $5,914 | $471,200 | $176,200 | $295,000 |
| 2018 | $5,952 | $446,200 | $173,300 | $272,900 |
| 2017 | $5,786 | $408,300 | $165,100 | $243,200 |
| 2016 | $4,969 | $346,000 | $157,200 | $188,800 |
| 2015 | $4,901 | $335,700 | $153,400 | $182,300 |
| 2014 | $4,748 | $319,500 | $150,000 | $169,500 |
Source: Public Records
Map
Nearby Homes
- 10 White St
- 73 Connell St
- 41 Wallace Rd
- 121 Hillside Ave
- 11 Rockwell Ave
- 60 Pond St
- 171 Milton St
- 169 Pine St
- 89 Puritan Dr
- 66 Unity St
- 129-131 Pine St
- 25 Carrolls Ln
- 1 Cityview Ln Unit 506
- 1 Cityview Ln Unit 210
- 1 Cityview Ln Unit 709
- 45 Marion St
- 29 Oconnell Ave
- 64 Shawmut St
- 111 Shawmut St
- 211 Copeland St