Estimated Value: $140,741 - $196,000
Studio
--
Bath
936
Sq Ft
$175/Sq Ft
Est. Value
About This Home
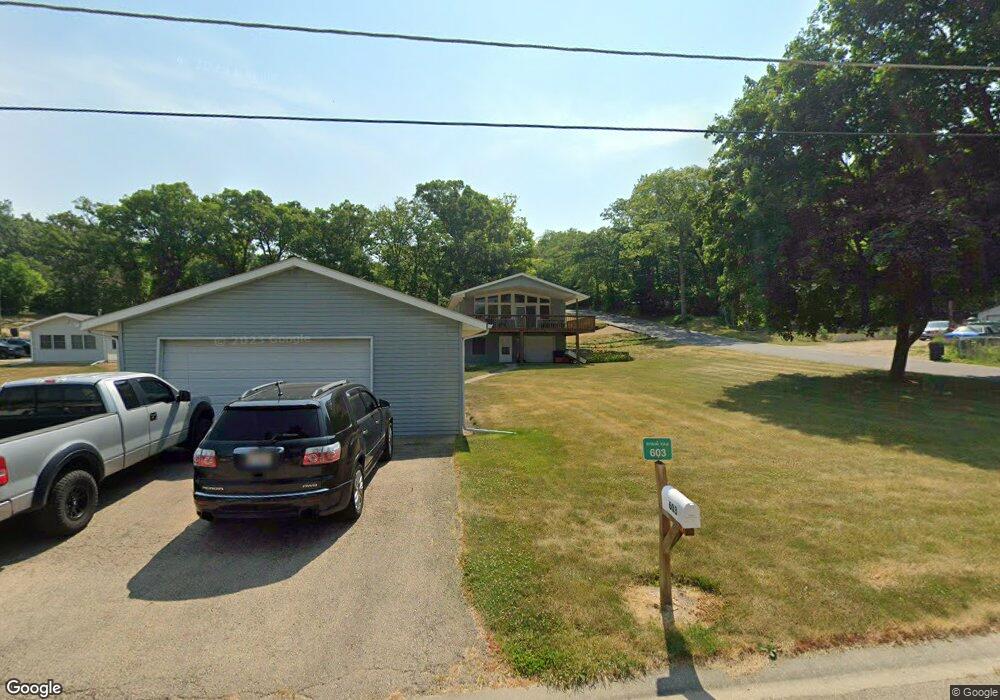
This home is located at 603 N View Crest Dr, Byron, IL 61010 and is currently estimated at $163,685, approximately $174 per square foot. 603 N View Crest Dr is a home located in Ogle County with nearby schools including Mary Morgan Elementary School, Byron Middle School, and Byron High School.
Ownership History
Date
Name
Owned For
Owner Type
Purchase Details
Closed on
Oct 12, 2012
Sold by
Johnson Twana M
Bought by
Johnson Traci L and Johnson Barbara S
Current Estimated Value
Home Financials for this Owner
Home Financials are based on the most recent Mortgage that was taken out on this home.
Original Mortgage
$56,250
Outstanding Balance
$9,721
Interest Rate
3.57%
Mortgage Type
New Conventional
Estimated Equity
$153,964
Purchase Details
Closed on
Oct 9, 2012
Sold by
Johnson Mary A
Bought by
Johnson Twana M
Home Financials for this Owner
Home Financials are based on the most recent Mortgage that was taken out on this home.
Original Mortgage
$56,250
Outstanding Balance
$9,721
Interest Rate
3.57%
Mortgage Type
New Conventional
Estimated Equity
$153,964
Purchase Details
Closed on
Oct 6, 2012
Sold by
Moyer Dale W
Bought by
Johnson Twana M
Home Financials for this Owner
Home Financials are based on the most recent Mortgage that was taken out on this home.
Original Mortgage
$56,250
Outstanding Balance
$9,721
Interest Rate
3.57%
Mortgage Type
New Conventional
Estimated Equity
$153,964
Create a Home Valuation Report for This Property
The Home Valuation Report is an in-depth analysis detailing your home's value as well as a comparison with similar homes in the area
Home Values in the Area
Average Home Value in this Area
Purchase History
| Date | Buyer | Sale Price | Title Company |
|---|---|---|---|
| Johnson Traci L | $75,000 | Nlt | |
| Johnson Twana M | -- | None Available | |
| Johnson Twana M | -- | Nlt | |
| Johnson Twana M | -- | None Available | |
| Johnson Twana M | -- | Nlt | |
| Johnson Twana M | -- | Nlt |
Source: Public Records
Mortgage History
| Date | Status | Borrower | Loan Amount |
|---|---|---|---|
| Open | Johnson Twana M | $56,250 |
Source: Public Records
Tax History
| Year | Tax Paid | Tax Assessment Tax Assessment Total Assessment is a certain percentage of the fair market value that is determined by local assessors to be the total taxable value of land and additions on the property. | Land | Improvement |
|---|---|---|---|---|
| 2024 | $3,285 | $46,488 | $9,396 | $37,092 |
| 2023 | $2,943 | $42,466 | $8,583 | $33,883 |
| 2022 | $2,830 | $40,452 | $8,176 | $32,276 |
| 2021 | $2,848 | $39,531 | $7,990 | $31,541 |
| 2020 | $2,514 | $37,756 | $7,631 | $30,125 |
| 2019 | $2,516 | $36,217 | $7,320 | $28,897 |
| 2018 | $2,577 | $36,217 | $7,320 | $28,897 |
| 2017 | $2,426 | $34,867 | $7,047 | $27,820 |
| 2016 | $2,372 | $34,356 | $6,944 | $27,412 |
| 2015 | $2,284 | $33,584 | $6,788 | $26,796 |
| 2014 | $2,282 | $33,584 | $6,788 | $26,796 |
| 2013 | $2,388 | $34,733 | $7,020 | $27,713 |
Source: Public Records
Map
Nearby Homes
- 105 E Oakwood Dr
- 1260 E Old Wagon Rd
- 754 E Equestrian Pointe Dr
- 754 E Equestrian Pointe Dr
- 261 W Redtail Ln
- 0 N Il Rt 2 Unit 202506208
- 0 N Il Rt 2 Unit MRD12481307
- 0 N Il Rt 2 Unit 25126463
- 7424 N River Rd
- 000 Silver Ridge Dr
- 265 Creekside Dr
- 309 Creekside Dr
- 820 Crest View Trail
- 808 Crest View Trail
- 932 W 2nd St
- 2422 N River Rd
- 1903 Silverthorn Dr
- 8890 Hales Corner Rd Rd
- 1245 Glacier Dr
- 1257 Glacier Dr
- 0000 E Oakwood Dr
- 001-002 E Oakwood Dr
- 205 E Oakwood Dr
- 205 E Hill Crest Dr
- 205 E Hill Crest Dr
- 702 N View Crest Dr
- 602 N View Crest Dr
- 703 N View Crest Dr
- 504 N View Crest Dr
- 206 E Hill Crest Dr
- 116 E Oakwood Dr
- 704 N View Crest Dr
- 123 E Oakwood Dr
- 210 E Hill Crest Dr
- 107 E Hill Crest Dr
- 207 E River View Dr
- 106 E Hill Crest Dr
- 114 E Oakwood Dr
- 207 E South Park Dr
- 122 E South Park Dr
Your Personal Tour Guide
Ask me questions while you tour the home.