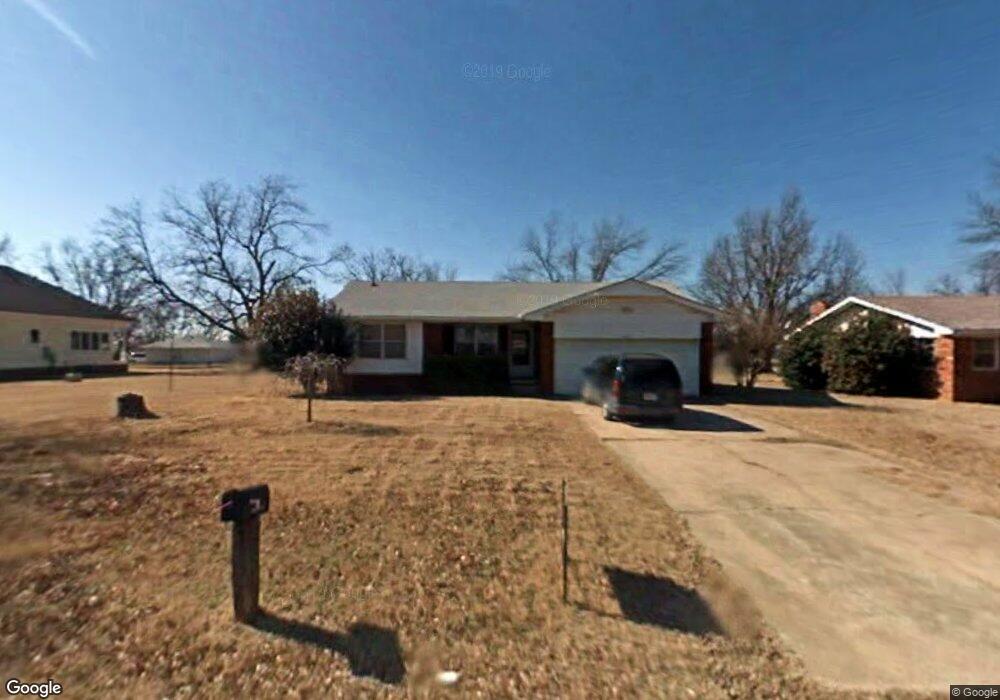
603 SW 2nd St Tuttle, OK 73089
Estimated Value: $145,420 - $174,000
2
Beds
2
Baths
1,073
Sq Ft
$153/Sq Ft
Est. Value
About This Home
This home is located at 603 SW 2nd St, Tuttle, OK 73089 and is currently estimated at $163,855, approximately $152 per square foot. 603 SW 2nd St is a home located in Grady County with nearby schools including Tuttle Intermediate School, Tuttle Elementary School, and Tuttle Middle School.
Ownership History
Date
Name
Owned For
Owner Type
Purchase Details
Closed on
Feb 22, 2008
Sold by
Long William Robert
Bought by
Dennis Nancy
Current Estimated Value
Home Financials for this Owner
Home Financials are based on the most recent Mortgage that was taken out on this home.
Original Mortgage
$50,000
Interest Rate
5.47%
Mortgage Type
New Conventional
Purchase Details
Closed on
May 21, 2007
Sold by
Hughes Bill and Hughes Brenda
Bought by
Jones Nell
Home Financials for this Owner
Home Financials are based on the most recent Mortgage that was taken out on this home.
Original Mortgage
$85,821
Interest Rate
6.22%
Mortgage Type
FHA
Purchase Details
Closed on
Jun 22, 2004
Sold by
Hughes Billy J and Hughes Brenda
Bought by
Hughes Living Trust
Purchase Details
Closed on
Mar 18, 2004
Sold by
Bradford Kelly D Fka Hu
Bought by
Hughes Billy J and Hughes Brenda
Purchase Details
Closed on
Aug 30, 2000
Sold by
Beulah and Orville Meyer
Bought by
Kelly D Hughes
Create a Home Valuation Report for This Property
The Home Valuation Report is an in-depth analysis detailing your home's value as well as a comparison with similar homes in the area
Home Values in the Area
Average Home Value in this Area
Purchase History
| Date | Buyer | Sale Price | Title Company |
|---|---|---|---|
| Dennis Nancy | $80,000 | None Available | |
| Jones Nell | $83,000 | None Available | |
| Hughes Living Trust | -- | -- | |
| Hughes Billy J | $70,000 | -- | |
| Kelly D Hughes | $57,000 | -- |
Source: Public Records
Mortgage History
| Date | Status | Borrower | Loan Amount |
|---|---|---|---|
| Closed | Dennis Nancy | $50,000 | |
| Previous Owner | Jones Nell | $85,821 |
Source: Public Records
Tax History Compared to Growth
Tax History
| Year | Tax Paid | Tax Assessment Tax Assessment Total Assessment is a certain percentage of the fair market value that is determined by local assessors to be the total taxable value of land and additions on the property. | Land | Improvement |
|---|---|---|---|---|
| 2025 | $997 | $10,464 | $2,214 | $8,250 |
| 2024 | $1,040 | $10,159 | $2,149 | $8,010 |
| 2023 | $1,040 | $9,863 | $2,056 | $7,807 |
| 2022 | $1,052 | $9,576 | $2,287 | $7,289 |
| 2021 | $1,086 | $9,851 | $2,287 | $7,564 |
| 2020 | $1,108 | $9,943 | $2,287 | $7,656 |
| 2019 | $1,119 | $10,223 | $2,287 | $7,936 |
| 2018 | $1,054 | $10,190 | $2,287 | $7,903 |
| 2017 | $1,081 | $10,187 | $2,283 | $7,904 |
| 2016 | $1,048 | $9,702 | $2,119 | $7,583 |
| 2015 | $902 | $9,240 | $1,243 | $7,997 |
| 2014 | $902 | $8,801 | $413 | $8,388 |
Source: Public Records
Map
Nearby Homes
- 605 SW 4th St
- 401 SW 4th St
- 304 SW 5th St
- 2 NW 6th St
- 508 Kings Ct
- 509 Cantebury Dr
- 516 Kings Ct
- 00 Chad Dr
- 2029 E Rock Creek Rd
- 2025 E Rock Creek Rd
- 1301 E Rock Creek Rd
- 1825 County Road 1205
- 1720 County Road 1213
- 1636 Big Sky Dr
- 975 Rylee Lane 4a Ln
- 1630 Big Sky Dr
- 1637 Big Sky Dr
- 973 Hadley Ln
- 977 Rylee Ln
- 975 Hadley Ln