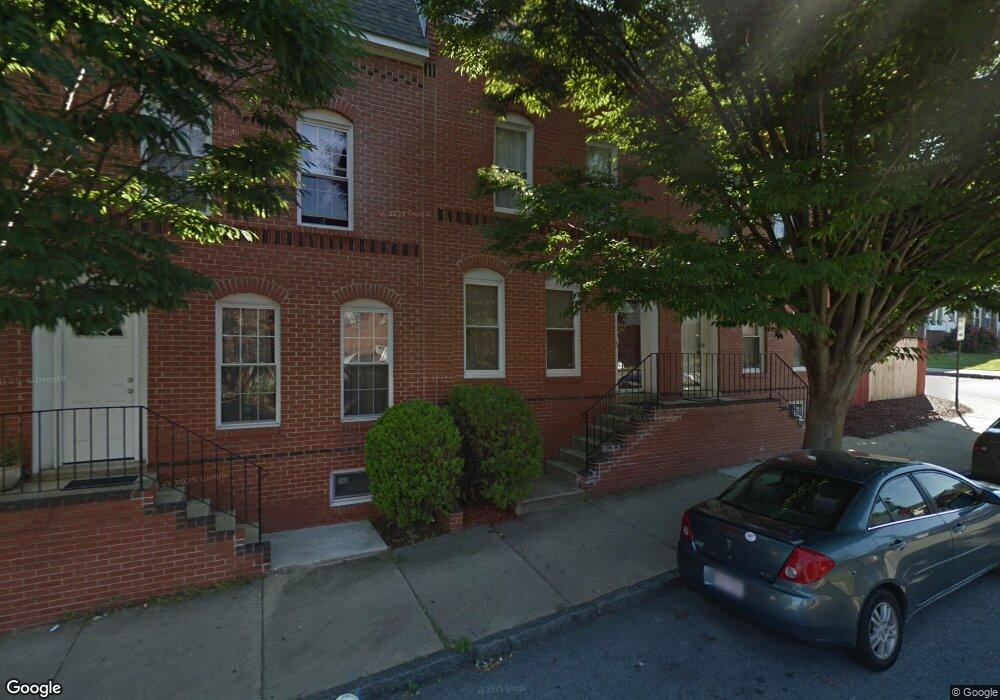
603 W 3rd St Wilmington, DE 19801
Downtown Wilmington NeighborhoodEstimated Value: $186,000 - $299,000
2
Beds
2
Baths
1,224
Sq Ft
$182/Sq Ft
Est. Value
About This Home
This home is located at 603 W 3rd St, Wilmington, DE 19801 and is currently estimated at $223,314, approximately $182 per square foot. 603 W 3rd St is a home located in New Castle County with nearby schools including The Bancroft School, The Bayard School, and Newark High School.
Ownership History
Date
Name
Owned For
Owner Type
Purchase Details
Closed on
Sep 22, 2014
Sold by
Partin Emmett M
Bought by
Citizens Bank Na and Rbs Citizens Na
Current Estimated Value
Purchase Details
Closed on
Jul 29, 2003
Sold by
Galeano Angel
Bought by
Etheridge Stacey
Home Financials for this Owner
Home Financials are based on the most recent Mortgage that was taken out on this home.
Original Mortgage
$84,350
Interest Rate
5.86%
Mortgage Type
Purchase Money Mortgage
Create a Home Valuation Report for This Property
The Home Valuation Report is an in-depth analysis detailing your home's value as well as a comparison with similar homes in the area
Home Values in the Area
Average Home Value in this Area
Purchase History
| Date | Buyer | Sale Price | Title Company |
|---|---|---|---|
| Citizens Bank Na | $30,600 | None Available | |
| Etheridge Stacey | $87,000 | -- |
Source: Public Records
Mortgage History
| Date | Status | Borrower | Loan Amount |
|---|---|---|---|
| Previous Owner | Etheridge Stacey | $84,350 |
Source: Public Records
Tax History Compared to Growth
Tax History
| Year | Tax Paid | Tax Assessment Tax Assessment Total Assessment is a certain percentage of the fair market value that is determined by local assessors to be the total taxable value of land and additions on the property. | Land | Improvement |
|---|---|---|---|---|
| 2024 | $1,810 | $52,700 | $8,100 | $44,600 |
| 2023 | $1,894 | $52,700 | $8,100 | $44,600 |
| 2022 | $1,875 | $52,700 | $8,100 | $44,600 |
| 2021 | $2,325 | $52,700 | $8,100 | $44,600 |
| 2020 | $1,774 | $52,700 | $8,100 | $44,600 |
| 2019 | $2,594 | $52,700 | $8,100 | $44,600 |
| 2018 | $1,515 | $52,700 | $8,100 | $44,600 |
| 2017 | $1,470 | $52,700 | $8,100 | $44,600 |
| 2016 | $1,466 | $52,700 | $8,100 | $44,600 |
| 2015 | $2,289 | $52,700 | $8,100 | $44,600 |
| 2014 | $2,288 | $52,700 | $8,100 | $44,600 |
Source: Public Records
Map
Nearby Homes