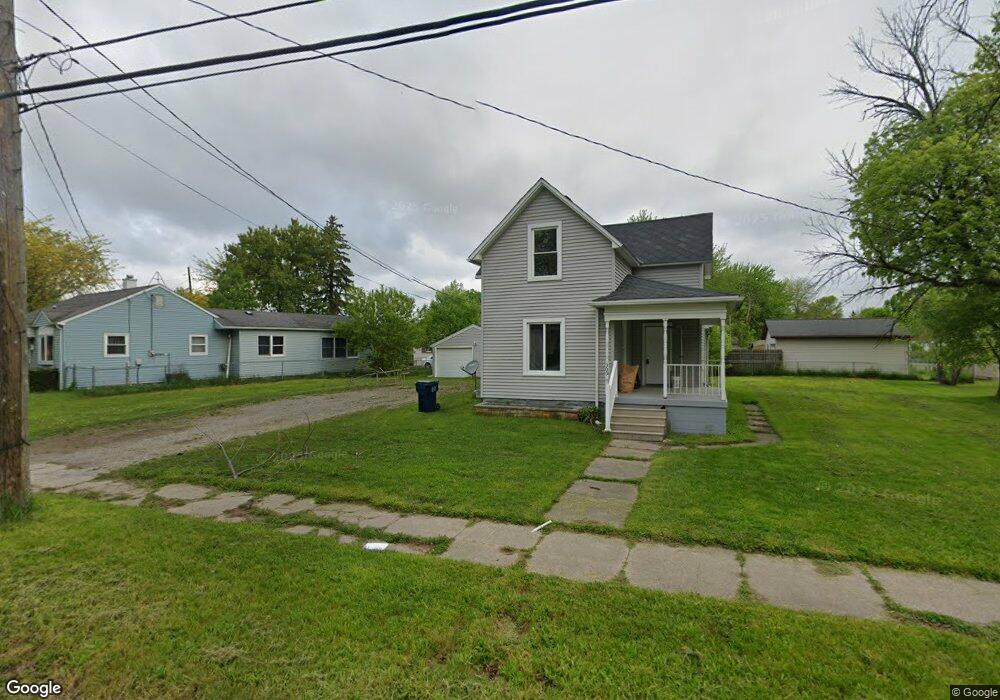
604 Bradley St Bay City, MI 48706
Estimated Value: $133,000 - $145,262
3
Beds
1
Bath
1,185
Sq Ft
$117/Sq Ft
Est. Value
About This Home
This home is located at 604 Bradley St, Bay City, MI 48706 and is currently estimated at $138,066, approximately $116 per square foot. 604 Bradley St is a home located in Bay County with nearby schools including Linsday Elementary School, Handy Middle School, and Bay City Central High School.
Ownership History
Date
Name
Owned For
Owner Type
Purchase Details
Closed on
Mar 11, 2009
Sold by
Berndt Sharon Lee
Bought by
Berndt Sharon Lee and Berndt Mark Edward
Current Estimated Value
Purchase Details
Closed on
Feb 3, 2009
Sold by
Berndt Sharon L and Berndt Marvin E
Bought by
Berndt Sharon L and Berndt Mark E
Purchase Details
Closed on
Aug 7, 2002
Sold by
Flores Robert and Flores Denise C
Bought by
Berndt Marvin E and Berndt Sharon L
Purchase Details
Closed on
Aug 13, 2001
Sold by
Prieur Gerald F and Knapp Kay
Bought by
Flores Robert and Flores Denise C
Purchase Details
Closed on
Apr 2, 1996
Sold by
Mead Charles A
Bought by
Prieur Gerald F and Knapp Kay A
Create a Home Valuation Report for This Property
The Home Valuation Report is an in-depth analysis detailing your home's value as well as a comparison with similar homes in the area
Home Values in the Area
Average Home Value in this Area
Purchase History
| Date | Buyer | Sale Price | Title Company |
|---|---|---|---|
| Berndt Sharon Lee | -- | None Available | |
| Berndt Sharon L | -- | Homeowners Title Agency | |
| Berndt Marvin E | $92,500 | -- | |
| Flores Robert | $89,400 | -- | |
| Prieur Gerald F | $57,500 | -- | |
| Prieur Gerald F | $57,500 | -- |
Source: Public Records
Tax History Compared to Growth
Tax History
| Year | Tax Paid | Tax Assessment Tax Assessment Total Assessment is a certain percentage of the fair market value that is determined by local assessors to be the total taxable value of land and additions on the property. | Land | Improvement |
|---|---|---|---|---|
| 2025 | $1,965 | $63,500 | $0 | $0 |
| 2024 | $1,617 | $56,250 | $0 | $0 |
| 2023 | $1,540 | $49,050 | $0 | $0 |
| 2022 | $1,769 | $44,500 | $0 | $0 |
| 2021 | $1,663 | $41,650 | $41,650 | $0 |
| 2020 | $1,768 | $36,950 | $36,950 | $0 |
| 2019 | $1,730 | $36,150 | $0 | $0 |
| 2018 | $1,712 | $35,000 | $0 | $0 |
| 2017 | $1,675 | $34,150 | $0 | $0 |
| 2016 | $1,694 | $34,400 | $0 | $34,400 |
| 2015 | $1,743 | $35,150 | $0 | $35,150 |
| 2014 | $1,743 | $35,750 | $0 | $35,750 |
Source: Public Records
Map
Nearby Homes