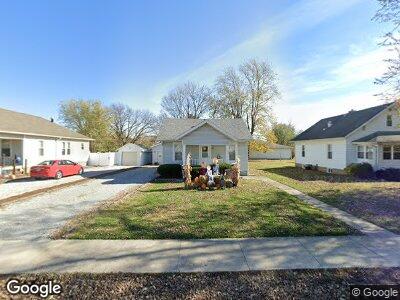
604 N 1st St Effingham, IL 62401
Estimated Value: $123,528 - $301,000
--
Bed
1
Bath
816
Sq Ft
$213/Sq Ft
Est. Value
About This Home
This home is located at 604 N 1st St, Effingham, IL 62401 and is currently estimated at $173,882, approximately $213 per square foot. 604 N 1st St is a home located in Effingham County with nearby schools including South Side Grade School, Early Learning Center, and Central Grade School.
Ownership History
Date
Name
Owned For
Owner Type
Purchase Details
Closed on
May 28, 2021
Sold by
Verdeyen Mark D
Bought by
Mayhaus Kelley
Current Estimated Value
Home Financials for this Owner
Home Financials are based on the most recent Mortgage that was taken out on this home.
Original Mortgage
$105,061
Outstanding Balance
$97,776
Interest Rate
3.25%
Mortgage Type
FHA
Purchase Details
Closed on
Jun 10, 2015
Sold by
Verdeyen Erin N and Verdeyen Mark D
Bought by
Verdeyen Mark D
Home Financials for this Owner
Home Financials are based on the most recent Mortgage that was taken out on this home.
Original Mortgage
$25,000
Interest Rate
4.03%
Mortgage Type
Future Advance Clause Open End Mortgage
Purchase Details
Closed on
May 31, 2006
Sold by
Mihlbachler Cody Anthony
Bought by
Verdeyen Mark D and Weber Erin N
Home Financials for this Owner
Home Financials are based on the most recent Mortgage that was taken out on this home.
Original Mortgage
$75,500
Interest Rate
6.68%
Mortgage Type
New Conventional
Create a Home Valuation Report for This Property
The Home Valuation Report is an in-depth analysis detailing your home's value as well as a comparison with similar homes in the area
Home Values in the Area
Average Home Value in this Area
Purchase History
| Date | Buyer | Sale Price | Title Company |
|---|---|---|---|
| Mayhaus Kelley | $107,000 | Accommodation | |
| Verdeyen Mark D | -- | None Available | |
| Verdeyen Mark D | -- | None Available |
Source: Public Records
Mortgage History
| Date | Status | Borrower | Loan Amount |
|---|---|---|---|
| Open | Walden Kelley R | $11,791 | |
| Open | Mayhaus Kelley | $105,061 | |
| Previous Owner | Verdeyen Mark D | $25,000 | |
| Previous Owner | Verdeyen Mark D | $73,750 | |
| Previous Owner | Verdeyen Mark D | $75,500 |
Source: Public Records
Tax History Compared to Growth
Tax History
| Year | Tax Paid | Tax Assessment Tax Assessment Total Assessment is a certain percentage of the fair market value that is determined by local assessors to be the total taxable value of land and additions on the property. | Land | Improvement |
|---|---|---|---|---|
| 2023 | $1,321 | $25,400 | $7,160 | $18,240 |
| 2022 | $1,121 | $23,300 | $6,570 | $16,730 |
| 2021 | $1,237 | $23,060 | $6,500 | $16,560 |
| 2020 | $1,203 | $22,410 | $6,320 | $16,090 |
| 2019 | $1,176 | $22,190 | $6,260 | $15,930 |
| 2018 | $1,121 | $21,340 | $6,020 | $15,320 |
| 2017 | $1,093 | $20,920 | $5,900 | $15,020 |
| 2016 | $1,057 | $20,310 | $5,730 | $14,580 |
| 2015 | -- | $19,720 | $5,560 | $14,160 |
| 2014 | -- | $19,150 | $5,400 | $13,750 |
| 2013 | -- | $18,770 | $5,290 | $13,480 |
| 2012 | -- | $18,490 | $5,210 | $13,280 |
Source: Public Records
Map
Nearby Homes
- 607 E Virginia Ave
- 702 N Oakwood St
- 510 N Merchant St
- 210 W Saint Anthony Ave
- 801 N Parkview St
- 1007 Crestwood Dr
- 414 W Kentucky Ave Unit B
- 414 W Kentucky Ave Unit A
- 1022 Penguin St
- 413 S 3rd St
- 1025 Cardinal Dr
- 601 Holiday Dr
- 501 S 5th St
- 700 E Gordon Ave
- 609 S 2nd St
- 700 W Jefferson Ave
- 407 W Edgar Ave
- 700 S Willow St
- 605 S 5th St
- 803 E Grove Ave