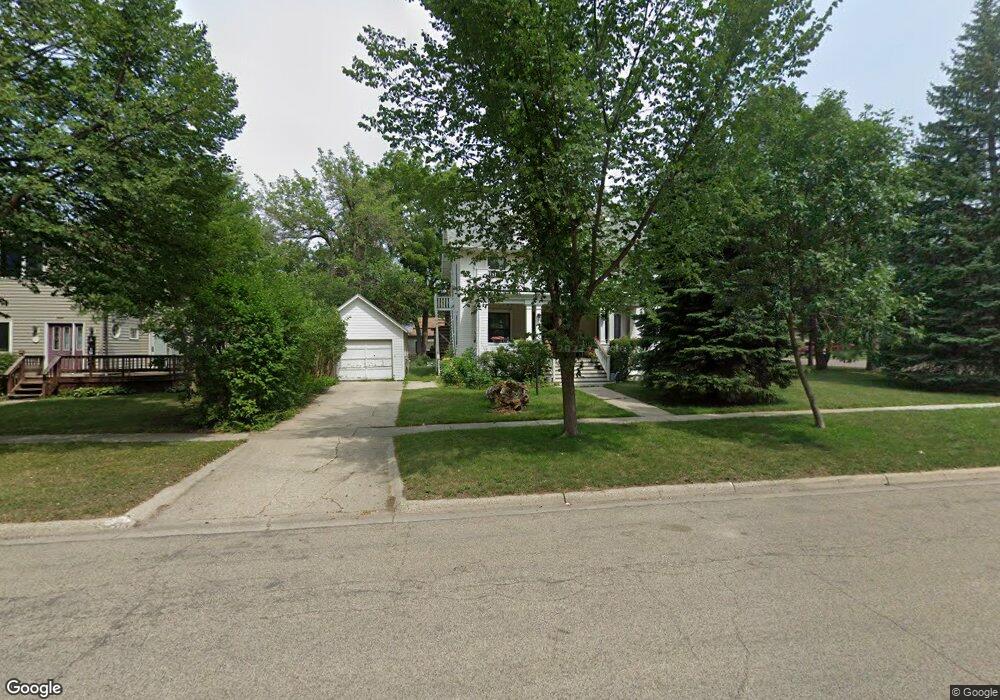
605 2nd St SW Pipestone, MN 56164
Estimated Value: $126,000 - $200,000
3
Beds
2
Baths
1,408
Sq Ft
$115/Sq Ft
Est. Value
About This Home
This home is located at 605 2nd St SW, Pipestone, MN 56164 and is currently estimated at $161,393, approximately $114 per square foot. 605 2nd St SW is a home located in Pipestone County with nearby schools including Pipestone Elementary School, Brown Elementary School, and Heartland Elementary School.
Ownership History
Date
Name
Owned For
Owner Type
Purchase Details
Closed on
Mar 15, 2024
Sold by
Barron Larry and Barron Twyla
Bought by
Hord Farms Holdings Llp
Current Estimated Value
Purchase Details
Closed on
Mar 11, 2020
Sold by
Dethmers Dean A and Dethmers Joni K
Bought by
Barron Larry and Barron Twyla
Home Financials for this Owner
Home Financials are based on the most recent Mortgage that was taken out on this home.
Original Mortgage
$114,950
Interest Rate
3.4%
Mortgage Type
New Conventional
Create a Home Valuation Report for This Property
The Home Valuation Report is an in-depth analysis detailing your home's value as well as a comparison with similar homes in the area
Home Values in the Area
Average Home Value in this Area
Purchase History
| Date | Buyer | Sale Price | Title Company |
|---|---|---|---|
| Hord Farms Holdings Llp | $165,000 | -- | |
| Barron Larry | $121,000 | Pipestone Abstract & Title C |
Source: Public Records
Mortgage History
| Date | Status | Borrower | Loan Amount |
|---|---|---|---|
| Previous Owner | Barron Larry | $114,950 |
Source: Public Records
Tax History Compared to Growth
Tax History
| Year | Tax Paid | Tax Assessment Tax Assessment Total Assessment is a certain percentage of the fair market value that is determined by local assessors to be the total taxable value of land and additions on the property. | Land | Improvement |
|---|---|---|---|---|
| 2025 | $2,556 | $154,400 | $8,800 | $145,600 |
| 2024 | $2,556 | $150,100 | $8,800 | $141,300 |
| 2023 | $2,314 | $138,400 | $8,800 | $129,600 |
| 2022 | $1,186 | $114,400 | $6,300 | $108,100 |
| 2021 | $946 | $95,200 | $6,300 | $88,900 |
| 2020 | $1,156 | $80,700 | $6,300 | $74,400 |
| 2019 | $1,108 | $77,100 | $5,000 | $72,100 |
| 2018 | $1,178 | $73,700 | $5,000 | $68,700 |
| 2017 | $1,146 | $79,700 | $5,000 | $74,700 |
| 2016 | $890 | $0 | $0 | $0 |
| 2015 | $438 | $21,200 | $3,114 | $18,086 |
| 2014 | $438 | $21,400 | $3,126 | $18,274 |
Source: Public Records
Map
Nearby Homes