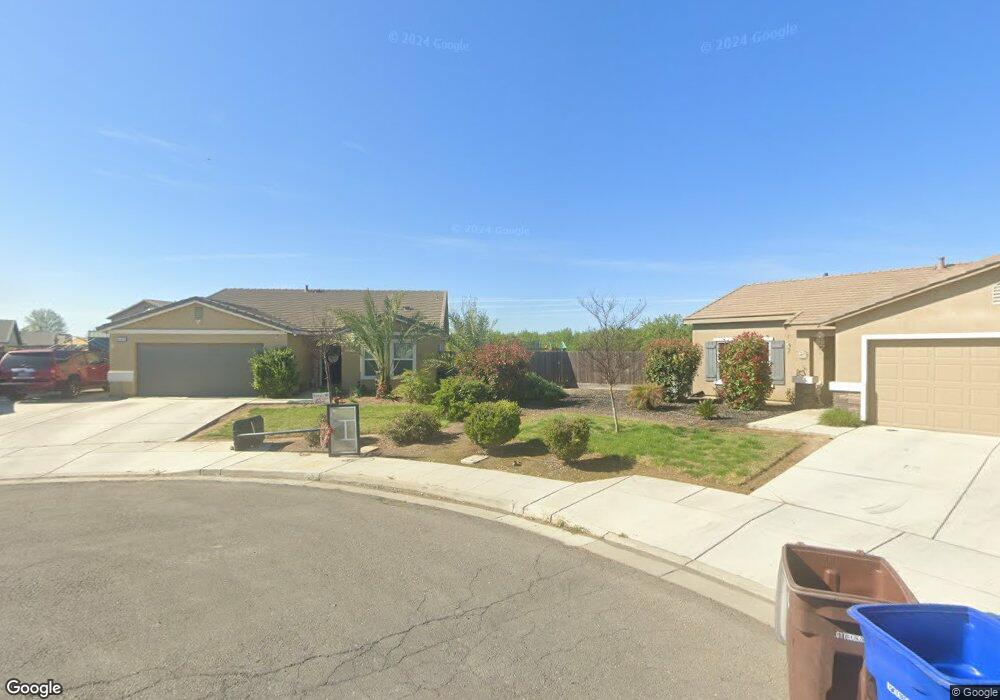
605 Peach Ct Chowchilla, CA 93610
Estimated Value: $406,194 - $438,000
3
Beds
2
Baths
1,798
Sq Ft
$235/Sq Ft
Est. Value
About This Home
This home is located at 605 Peach Ct, Chowchilla, CA 93610 and is currently estimated at $423,049, approximately $235 per square foot. 605 Peach Ct is a home with nearby schools including Merle L. Fuller Elementary School, Stephens Elementary School, and Ronald Reagan Elementary School.
Ownership History
Date
Name
Owned For
Owner Type
Purchase Details
Closed on
Nov 4, 2017
Sold by
Western Pacific Housing Inc
Bought by
Chavarria Anthony and Chavarria Roxann
Current Estimated Value
Home Financials for this Owner
Home Financials are based on the most recent Mortgage that was taken out on this home.
Original Mortgage
$230,900
Outstanding Balance
$193,941
Interest Rate
3.94%
Mortgage Type
Adjustable Rate Mortgage/ARM
Estimated Equity
$229,108
Create a Home Valuation Report for This Property
The Home Valuation Report is an in-depth analysis detailing your home's value as well as a comparison with similar homes in the area
Home Values in the Area
Average Home Value in this Area
Purchase History
| Date | Buyer | Sale Price | Title Company |
|---|---|---|---|
| Chavarria Anthony | $251,000 | Old Republic Title Company |
Source: Public Records
Mortgage History
| Date | Status | Borrower | Loan Amount |
|---|---|---|---|
| Open | Chavarria Anthony | $230,900 |
Source: Public Records
Tax History Compared to Growth
Tax History
| Year | Tax Paid | Tax Assessment Tax Assessment Total Assessment is a certain percentage of the fair market value that is determined by local assessors to be the total taxable value of land and additions on the property. | Land | Improvement |
|---|---|---|---|---|
| 2025 | $3,172 | $285,589 | $45,510 | $240,079 |
| 2023 | $3,172 | $274,501 | $43,744 | $230,757 |
| 2022 | $2,973 | $269,120 | $42,887 | $226,233 |
| 2021 | $2,934 | $263,845 | $42,047 | $221,798 |
| 2020 | $2,861 | $261,140 | $41,616 | $219,524 |
| 2019 | $2,838 | $256,020 | $40,800 | $215,220 |
| 2018 | $2,777 | $251,000 | $40,000 | $211,000 |
| 2017 | $534 | $39,000 | $39,000 | $0 |
| 2016 | $398 | $27,000 | $27,000 | $0 |
| 2015 | $377 | $25,000 | $25,000 | $0 |
| 2014 | $326 | $20,000 | $20,000 | $0 |
Source: Public Records
Map
Nearby Homes
- 570 Parkridge Dr
- 589 Victoria Ave
- 584 Riley Ave
- 588 Riley Ave
- 585 Riley Ave
- 592 Riley Ave
- 593 Riley Ave
- 589 Riley Ave
- 581 Riley Ave
- Roanoke Plan at Orchard View
- Dublin Plan at Orchard View
- Beaumont Plan at Orchard View
- Abernathy Plan at Orchard View
- Cumberland Plan at Orchard View
- Cabot Plan at Orchard View
- 428 Oleander Dr
- 1604 Parkridge Dr
- 881 Gill Way
- 105 Cedar Ct
- 1112 Sonoma Ave