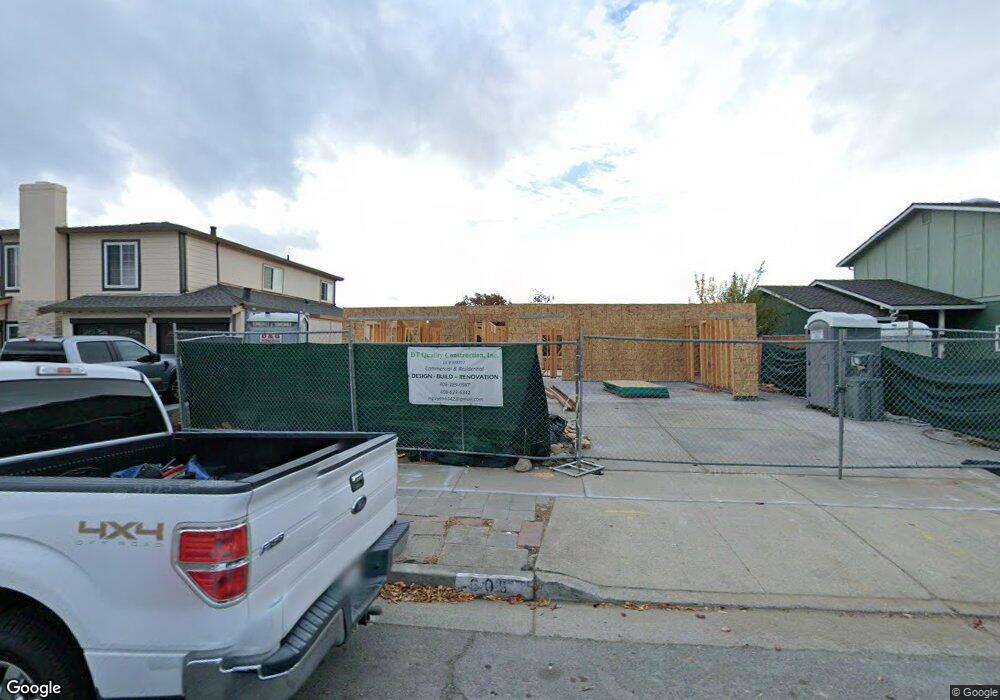
605 Rough And Ready Rd San Jose, CA 95133
Penitencia NeighborhoodEstimated Value: $1,185,189 - $1,259,000
3
Beds
2
Baths
1,146
Sq Ft
$1,079/Sq Ft
Est. Value
About This Home
This home is located at 605 Rough And Ready Rd, San Jose, CA 95133 and is currently estimated at $1,237,047, approximately $1,079 per square foot. 605 Rough And Ready Rd is a home located in Santa Clara County with nearby schools including Ben Painter Elementary School, William Sheppard Middle School, and James Lick High School.
Ownership History
Date
Name
Owned For
Owner Type
Purchase Details
Closed on
Jan 11, 2008
Sold by
Phan Thanh Tat and Nguyen Thuy Diem
Bought by
Phan Thanh T and Nguyen Thuy Diem
Current Estimated Value
Home Financials for this Owner
Home Financials are based on the most recent Mortgage that was taken out on this home.
Original Mortgage
$417,000
Outstanding Balance
$261,982
Interest Rate
6.07%
Mortgage Type
New Conventional
Estimated Equity
$975,065
Purchase Details
Closed on
Jul 2, 2007
Sold by
Vu Hanh Kim and Vuong Man Hoang
Bought by
Phan Thanh Tat and Nguyen Thuy Diem
Home Financials for this Owner
Home Financials are based on the most recent Mortgage that was taken out on this home.
Original Mortgage
$417,000
Interest Rate
6.73%
Mortgage Type
Purchase Money Mortgage
Purchase Details
Closed on
Mar 19, 2003
Sold by
Vu Hanh Kim
Bought by
Vu Hanh Kim and Vuong Man Hoang
Purchase Details
Closed on
Aug 27, 2002
Sold by
Vuong Man Hoang and Vu Hanh
Bought by
Vu Hanh Kim
Create a Home Valuation Report for This Property
The Home Valuation Report is an in-depth analysis detailing your home's value as well as a comparison with similar homes in the area
Home Values in the Area
Average Home Value in this Area
Purchase History
| Date | Buyer | Sale Price | Title Company |
|---|---|---|---|
| Phan Thanh T | -- | Fidelity National Title Co | |
| Phan Thanh Tat | $585,000 | Chicago Title Company | |
| Vu Hanh Kim | -- | -- | |
| Vu Hanh Kim | -- | -- |
Source: Public Records
Mortgage History
| Date | Status | Borrower | Loan Amount |
|---|---|---|---|
| Open | Phan Thanh T | $417,000 | |
| Closed | Phan Thanh Tat | $417,000 |
Source: Public Records
Tax History Compared to Growth
Tax History
| Year | Tax Paid | Tax Assessment Tax Assessment Total Assessment is a certain percentage of the fair market value that is determined by local assessors to be the total taxable value of land and additions on the property. | Land | Improvement |
|---|---|---|---|---|
| 2025 | $11,322 | $589,177 | $461,037 | $128,140 |
| 2024 | $11,322 | $753,328 | $451,998 | $301,330 |
| 2023 | $11,109 | $738,558 | $443,136 | $295,422 |
| 2022 | $10,895 | $724,078 | $434,448 | $289,630 |
| 2021 | $10,530 | $709,881 | $425,930 | $283,951 |
| 2020 | $10,342 | $702,603 | $421,563 | $281,040 |
| 2019 | $10,064 | $688,828 | $413,298 | $275,530 |
| 2018 | $9,939 | $675,323 | $405,195 | $270,128 |
| 2017 | $9,986 | $662,082 | $397,250 | $264,832 |
| 2016 | $9,418 | $649,101 | $389,461 | $259,640 |
| 2015 | $8,899 | $599,000 | $359,400 | $239,600 |
| 2014 | $7,088 | $490,000 | $294,000 | $196,000 |
Source: Public Records
Map
Nearby Homes
- 2623 Gimelli Place Unit 139
- 714 N Capitol Ave
- 2599 Easton Ln Unit 108
- 2599 Easton Ln Unit 109
- 2714 Mabury Square
- 750 Fruit Ranch Loop
- 2580 Gimelli Way
- 571 Apricot Way
- 673 Kirk Glen Dr
- 559 Apricot Way
- 674 Galleon Ct
- 693 Kirk Glen Dr
- 2420 Kita Ln
- 633 Easton Dr
- 709 Whitewater Ct Unit 44
- 811 Salt Lake Dr
- 2806 Glauser Dr
- 825 N Capitol Ave Unit 4
- 2369 Mabury Rd
- 259 N Capitol Ave Unit 171
- 597 Rough And Ready Rd
- 607 Rough And Ready Rd
- 589 Rough And Ready Rd
- 2775 Rainview Dr
- 2771 Rainview Dr
- 615 Rough And Ready Rd
- 581 Rough And Ready Rd
- 2779 Rainview Dr
- 624 Des Moines Place
- 616 Des Moines Place
- 596 Rough And Ready Rd
- 604 Rough And Ready Rd
- 612 Rough And Ready Rd
- 577 Rough And Ready Rd
- 2767 Rainview Dr
- 623 Rough And Ready Rd
- 2783 Rainview Dr
- 588 Rough And Ready Rd
- 624 Rough And Ready Rd
- 632 Des Moines Place Unit 54