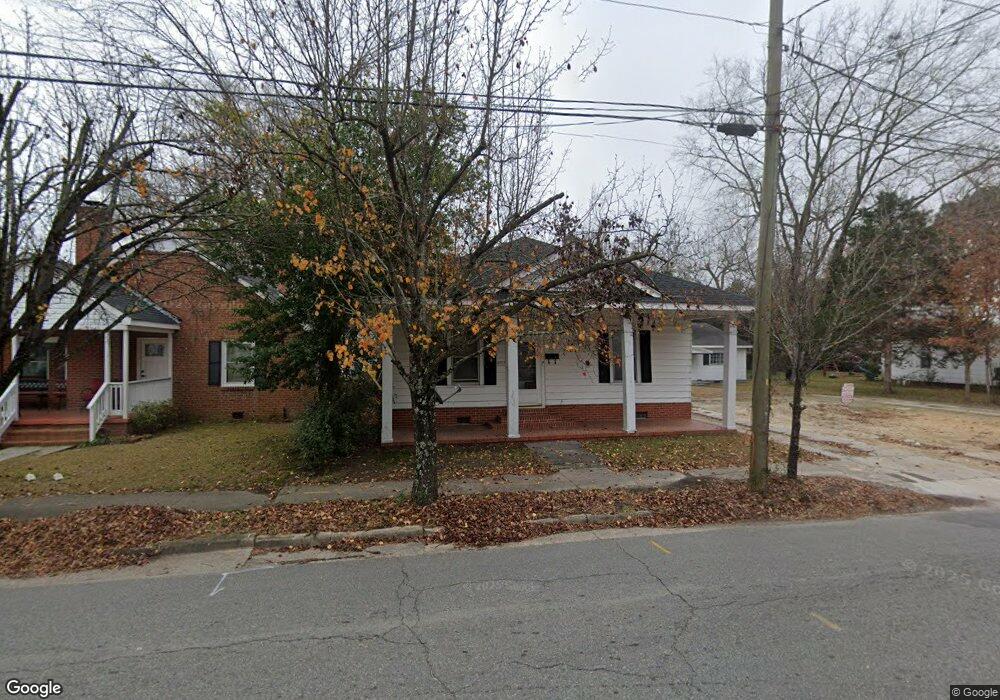
605 S 3rd St Smithfield, NC 27577
Estimated Value: $220,000 - $251,000
3
Beds
1
Bath
1,395
Sq Ft
$165/Sq Ft
Est. Value
About This Home
This home is located at 605 S 3rd St, Smithfield, NC 27577 and is currently estimated at $229,606, approximately $164 per square foot. 605 S 3rd St is a home located in Johnston County with nearby schools including South Smithfield Elementary School, Smithfield Middle School, and Smithfield-Selma High School.
Ownership History
Date
Name
Owned For
Owner Type
Purchase Details
Closed on
May 18, 2020
Sold by
Durham James M and Durham Sarah H
Bought by
Durham & Associates Llc
Current Estimated Value
Purchase Details
Closed on
Dec 18, 2008
Sold by
Durham Jerry D and Durham Jerry Dennis
Bought by
Durham James M
Purchase Details
Closed on
Dec 4, 2008
Sold by
Flint Walker H
Bought by
Durham James M
Purchase Details
Closed on
May 25, 2001
Sold by
Doris K Durham Family Est Trst
Bought by
Durham Doris K
Create a Home Valuation Report for This Property
The Home Valuation Report is an in-depth analysis detailing your home's value as well as a comparison with similar homes in the area
Home Values in the Area
Average Home Value in this Area
Purchase History
| Date | Buyer | Sale Price | Title Company |
|---|---|---|---|
| Durham & Associates Llc | -- | None Available | |
| Durham James M | $94,500 | None Available | |
| Durham James M | $44,500 | None Available | |
| Durham Doris K | -- | -- |
Source: Public Records
Tax History
| Year | Tax Paid | Tax Assessment Tax Assessment Total Assessment is a certain percentage of the fair market value that is determined by local assessors to be the total taxable value of land and additions on the property. | Land | Improvement |
|---|---|---|---|---|
| 2025 | $2,164 | $223,060 | $70,000 | $153,060 |
| 2024 | $1,572 | $126,790 | $45,000 | $81,790 |
| 2023 | $1,598 | $126,790 | $45,000 | $81,790 |
| 2022 | $1,648 | $126,790 | $45,000 | $81,790 |
| 2021 | $1,648 | $126,790 | $45,000 | $81,790 |
| 2020 | $1,686 | $126,790 | $45,000 | $81,790 |
| 2019 | $1,686 | $126,790 | $45,000 | $81,790 |
| 2018 | $1,248 | $92,480 | $20,930 | $71,550 |
| 2017 | $1,248 | $92,480 | $20,930 | $71,550 |
| 2016 | $1,248 | $92,480 | $20,930 | $71,550 |
| 2015 | $1,248 | $92,480 | $20,930 | $71,550 |
| 2014 | $1,248 | $92,480 | $20,930 | $71,550 |
Source: Public Records
Map
Nearby Homes
Your Personal Tour Guide
Ask me questions while you tour the home.