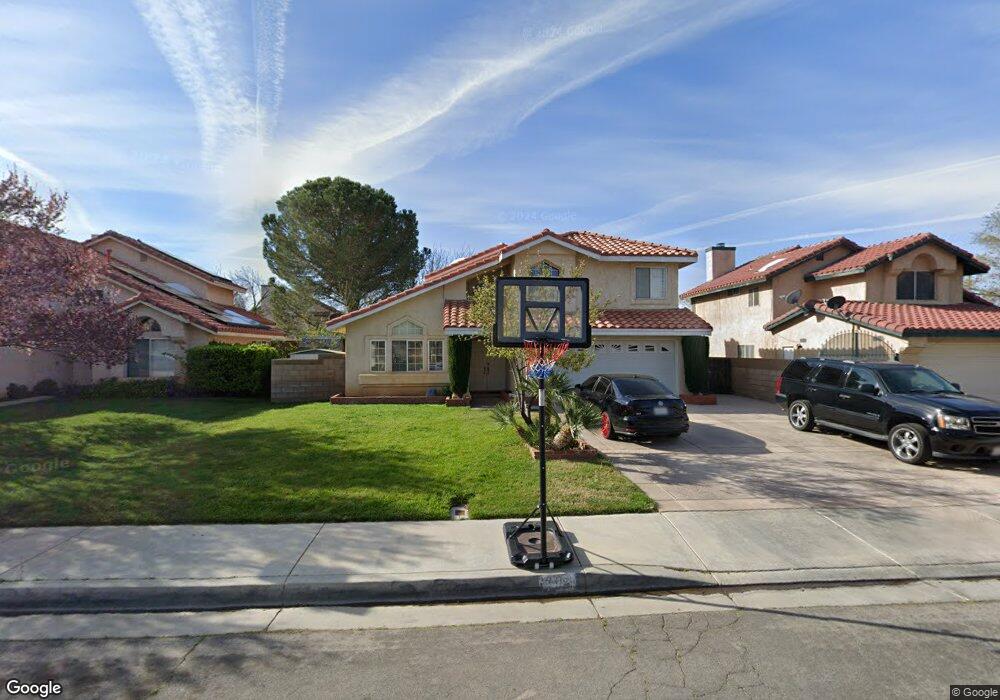
606 Beverly Ct Lancaster, CA 93535
East Lancaster NeighborhoodEstimated Value: $440,000 - $473,000
4
Beds
3
Baths
1,672
Sq Ft
$271/Sq Ft
Est. Value
About This Home
This home is located at 606 Beverly Ct, Lancaster, CA 93535 and is currently estimated at $453,112, approximately $271 per square foot. 606 Beverly Ct is a home located in Los Angeles County with nearby schools including Joshua Elementary, New Vista Middle School, and Antelope Valley High School.
Ownership History
Date
Name
Owned For
Owner Type
Purchase Details
Closed on
Feb 20, 2020
Sold by
Becerra Sonia P and Martinez Sonia
Bought by
Becerra Sonia Patricia
Current Estimated Value
Home Financials for this Owner
Home Financials are based on the most recent Mortgage that was taken out on this home.
Original Mortgage
$163,000
Outstanding Balance
$144,325
Interest Rate
3.6%
Mortgage Type
New Conventional
Estimated Equity
$308,787
Purchase Details
Closed on
Sep 15, 2015
Sold by
Becerra Jose
Bought by
Becerra Sonia P and Martinez Sonia
Purchase Details
Closed on
Aug 4, 1995
Sold by
Federal Home Loan Mortgage Corporation
Bought by
Becerra Jose and Martinez Sonia
Home Financials for this Owner
Home Financials are based on the most recent Mortgage that was taken out on this home.
Original Mortgage
$97,546
Interest Rate
7.63%
Mortgage Type
FHA
Purchase Details
Closed on
Mar 27, 1995
Sold by
Roth Jack Joseph and Roth Doreen Lee
Bought by
Federal Home Loan Mortgage Corporation
Create a Home Valuation Report for This Property
The Home Valuation Report is an in-depth analysis detailing your home's value as well as a comparison with similar homes in the area
Home Values in the Area
Average Home Value in this Area
Purchase History
| Date | Buyer | Sale Price | Title Company |
|---|---|---|---|
| Becerra Sonia Patricia | -- | Pacific Coast Title Company | |
| Becerra Sonia P | -- | Lawyers Title La | |
| Becerra Jose | $98,000 | American Title | |
| Federal Home Loan Mortgage Corporation | $99,000 | Chicago Title Company |
Source: Public Records
Mortgage History
| Date | Status | Borrower | Loan Amount |
|---|---|---|---|
| Open | Becerra Sonia Patricia | $163,000 | |
| Closed | Becerra Jose | $97,546 |
Source: Public Records
Tax History
| Year | Tax Paid | Tax Assessment Tax Assessment Total Assessment is a certain percentage of the fair market value that is determined by local assessors to be the total taxable value of land and additions on the property. | Land | Improvement |
|---|---|---|---|---|
| 2025 | $3,314 | $162,774 | $32,544 | $130,230 |
| 2024 | $3,314 | $159,583 | $31,906 | $127,677 |
| 2023 | $3,247 | $156,455 | $31,281 | $125,174 |
| 2022 | $3,058 | $153,388 | $30,668 | $122,720 |
| 2021 | $2,672 | $150,381 | $30,067 | $120,314 |
| 2019 | $2,601 | $145,923 | $29,176 | $116,747 |
| 2018 | $2,556 | $143,062 | $28,604 | $114,458 |
| 2016 | $2,425 | $137,509 | $27,495 | $110,014 |
| 2015 | $2,397 | $135,444 | $27,082 | $108,362 |
| 2014 | $2,392 | $132,792 | $26,552 | $106,240 |
Source: Public Records
Map
Nearby Homes
- 415 E Avenue j13
- 443 Corona Ct
- 660 E Avenue j10
- 43865 Gingham Ave
- 0 7th St East @ J-14 Unit 26001768
- 47500 5th St E
- 143 E Avenue j7
- 44003 7th St E
- 309 E Avenue j13
- 43640 Foxton Ave
- 44022 Andale Ave
- 43963 Glenraven Rd
- 44047 Rodin Ave
- 321 E Avenue j8
- 43453 7th St E
- 321 E Avenue J 8
- 0 E Standridge Ave Unit 26001975
- 0 Stanridge Ave
- 0 10th St East @ Ave J11 (Challenger) Unit 26002041
- 44025 Glenraven Rd
Your Personal Tour Guide
Ask me questions while you tour the home.