608 36th St Sacramento, CA 95816
East Sacramento NeighborhoodEstimated Value: $630,000 - $1,010,000
3
Beds
2
Baths
2,347
Sq Ft
$342/Sq Ft
Est. Value
About This Home
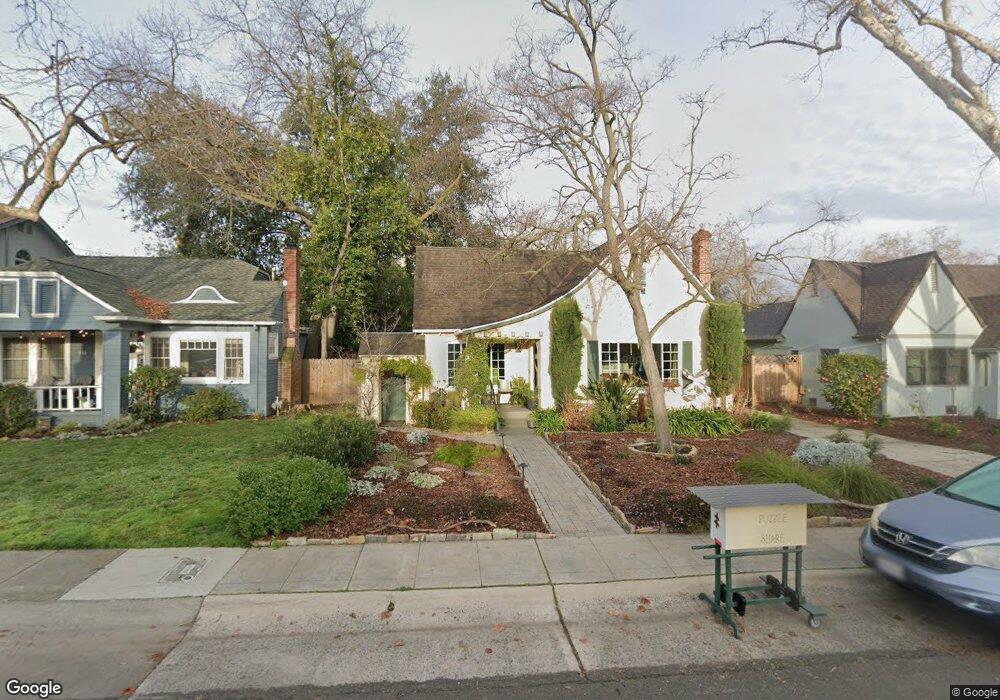
This home is located at 608 36th St, Sacramento, CA 95816 and is currently estimated at $803,289, approximately $342 per square foot. 608 36th St is a home located in Sacramento County with nearby schools including Theodore Judah Elementary, Miwok Middle School, and Hiram W. Johnson High School.
Ownership History
Date
Name
Owned For
Owner Type
Purchase Details
Closed on
Mar 12, 2005
Sold by
Vanhoof John L and Vanhoof Van Hoof
Bought by
Vanhoof John L and Vanhoof Van Hoof
Current Estimated Value
Purchase Details
Closed on
Dec 19, 1994
Sold by
Muller David W and Muller Susan A
Bought by
Vanhoof John L and Vanhoof Katherine
Home Financials for this Owner
Home Financials are based on the most recent Mortgage that was taken out on this home.
Original Mortgage
$190,000
Interest Rate
9.2%
Mortgage Type
Seller Take Back
Purchase Details
Closed on
Jun 22, 1994
Sold by
Schuler Felix Arnold and Bertolani Catherine M
Bought by
Muller David W and Muller Susan A
Purchase Details
Closed on
Jun 21, 1994
Sold by
Ambrose G Louis
Bought by
Ambrose Patricia
Create a Home Valuation Report for This Property
The Home Valuation Report is an in-depth analysis detailing your home's value as well as a comparison with similar homes in the area
Home Values in the Area
Average Home Value in this Area
Purchase History
| Date | Buyer | Sale Price | Title Company |
|---|---|---|---|
| Vanhoof John L | -- | -- | |
| Vanhoof John L | $190,000 | Sacramento Title Company | |
| Muller David W | $190,000 | North American Title Co Inc | |
| Ambrose Patricia | -- | North American Title Company |
Source: Public Records
Mortgage History
| Date | Status | Borrower | Loan Amount |
|---|---|---|---|
| Closed | Vanhoof John L | $190,000 |
Source: Public Records
Tax History Compared to Growth
Tax History
| Year | Tax Paid | Tax Assessment Tax Assessment Total Assessment is a certain percentage of the fair market value that is determined by local assessors to be the total taxable value of land and additions on the property. | Land | Improvement |
|---|---|---|---|---|
| 2025 | $4,137 | $335,906 | $92,365 | $243,541 |
| 2024 | $4,137 | $329,320 | $90,554 | $238,766 |
| 2023 | $4,041 | $322,864 | $88,779 | $234,085 |
| 2022 | $3,973 | $316,535 | $87,039 | $229,496 |
| 2021 | $3,790 | $310,330 | $85,333 | $224,997 |
| 2020 | $3,818 | $307,149 | $84,459 | $222,690 |
| 2019 | $3,739 | $301,127 | $82,803 | $218,324 |
| 2018 | $3,643 | $295,224 | $81,180 | $214,044 |
| 2017 | $3,594 | $289,437 | $79,589 | $209,848 |
| 2016 | $3,457 | $283,763 | $78,029 | $205,734 |
| 2015 | $3,390 | $279,501 | $76,857 | $202,644 |
| 2014 | $3,300 | $274,027 | $75,352 | $198,675 |
Source: Public Records
Map
Nearby Homes