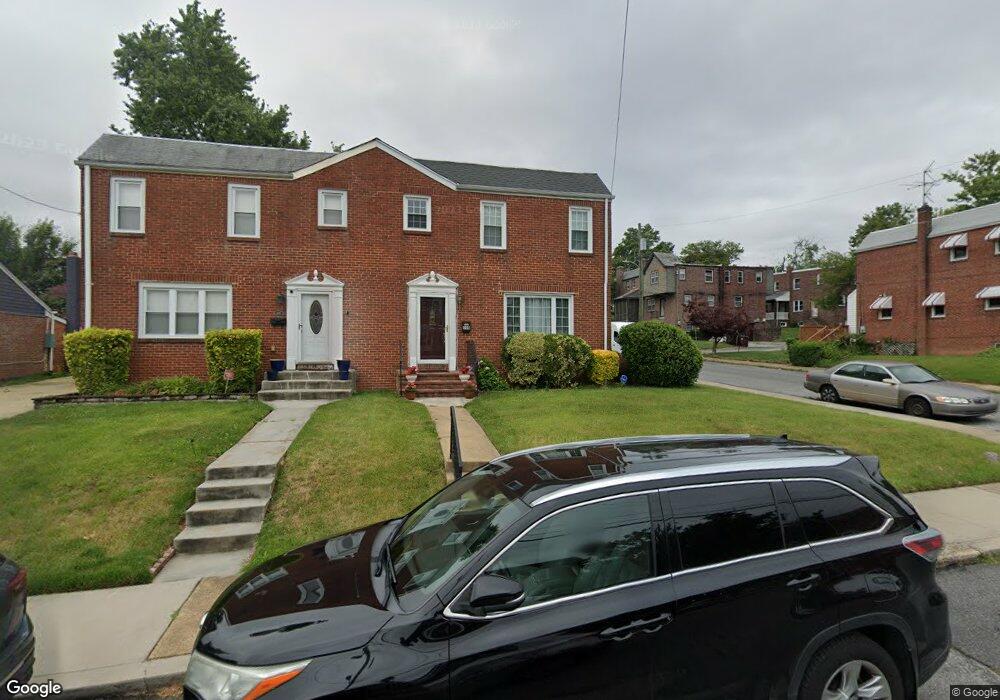
608 W 38th St Wilmington, DE 19802
Northwest Wilmington NeighborhoodEstimated Value: $233,000 - $315,000
3
Beds
2
Baths
1,488
Sq Ft
$186/Sq Ft
Est. Value
About This Home
This home is located at 608 W 38th St, Wilmington, DE 19802 and is currently estimated at $276,026, approximately $185 per square foot. 608 W 38th St is a home located in New Castle County with nearby schools including Harlan (David W. ) Elementary School, Pierre S. Dupont Middle School, and Concord High School.
Ownership History
Date
Name
Owned For
Owner Type
Purchase Details
Closed on
Dec 5, 2002
Sold by
Kreston Carolyn and Lavin Elaine
Bought by
Bhagloo Michael G and Bhagloo Evelyn
Current Estimated Value
Home Financials for this Owner
Home Financials are based on the most recent Mortgage that was taken out on this home.
Original Mortgage
$123,028
Outstanding Balance
$53,226
Interest Rate
6.34%
Mortgage Type
FHA
Estimated Equity
$222,800
Create a Home Valuation Report for This Property
The Home Valuation Report is an in-depth analysis detailing your home's value as well as a comparison with similar homes in the area
Home Values in the Area
Average Home Value in this Area
Purchase History
| Date | Buyer | Sale Price | Title Company |
|---|---|---|---|
| Bhagloo Michael G | $124,000 | -- |
Source: Public Records
Mortgage History
| Date | Status | Borrower | Loan Amount |
|---|---|---|---|
| Open | Bhagloo Michael G | $123,028 |
Source: Public Records
Tax History Compared to Growth
Tax History
| Year | Tax Paid | Tax Assessment Tax Assessment Total Assessment is a certain percentage of the fair market value that is determined by local assessors to be the total taxable value of land and additions on the property. | Land | Improvement |
|---|---|---|---|---|
| 2024 | $1,735 | $53,700 | $9,400 | $44,300 |
| 2023 | $1,575 | $53,700 | $9,400 | $44,300 |
| 2022 | $1,592 | $53,700 | $9,400 | $44,300 |
| 2021 | $1,590 | $53,700 | $9,400 | $44,300 |
| 2020 | $1,593 | $53,700 | $9,400 | $44,300 |
| 2019 | $2,672 | $53,700 | $9,400 | $44,300 |
| 2018 | $1,540 | $53,700 | $9,400 | $44,300 |
| 2017 | $1,529 | $53,700 | $9,400 | $44,300 |
| 2016 | $1,528 | $53,700 | $9,400 | $44,300 |
| 2015 | $2,383 | $53,700 | $9,400 | $44,300 |
| 2014 | $2,382 | $53,700 | $9,400 | $44,300 |
Source: Public Records
Map
Nearby Homes
- 707 W 38th St
- 714 W 38th St
- 508 W 39th St
- 601 Coverly Rd
- 804 W Matson Run Pkwy
- 3601 N Madison St
- 310 W 37th St
- 4316 Miller Rd
- 4318 Miller Rd
- 504 W 34th St
- 411 W 34th St
- 306 W 35th St
- 4314 Miller Rd
- 3107 N Monroe St
- 213 W 35th St
- 202 W 35th St
- 3100 N Madison St
- 4404 Miller Rd
- 590 W 30th St
- 25 W 39th St