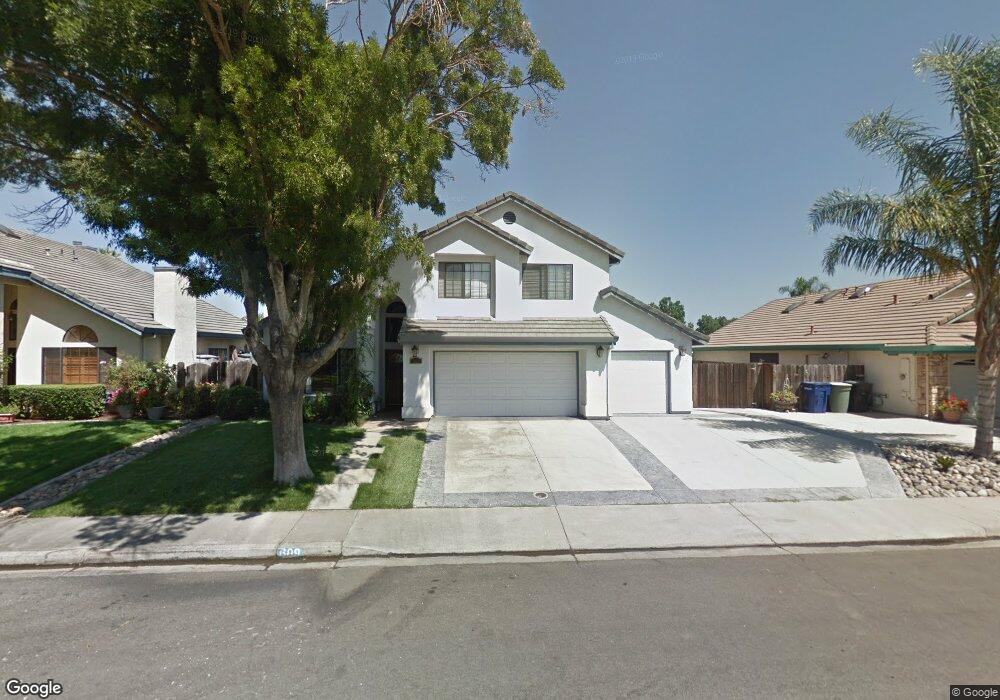
609 Berlin Way Patterson, CA 95363
Estimated Value: $174,000 - $539,000
4
Beds
3
Baths
2,363
Sq Ft
$183/Sq Ft
Est. Value
About This Home
This home is located at 609 Berlin Way, Patterson, CA 95363 and is currently estimated at $432,366, approximately $182 per square foot. 609 Berlin Way is a home located in Stanislaus County with nearby schools including Walnut Grove Elementary School, Creekside Middle School, and Patterson High School.
Ownership History
Date
Name
Owned For
Owner Type
Purchase Details
Closed on
Dec 29, 2010
Sold by
Federal Home Loan Mortgage Corporation
Bought by
Rodriguez Gustavo and Rodriguez Valentina F
Current Estimated Value
Home Financials for this Owner
Home Financials are based on the most recent Mortgage that was taken out on this home.
Original Mortgage
$146,197
Outstanding Balance
$97,178
Interest Rate
4.34%
Mortgage Type
FHA
Estimated Equity
$335,188
Purchase Details
Closed on
Sep 24, 2010
Sold by
Tri Counties Bank
Bought by
Federal Home Loan Mortgage Corp
Purchase Details
Closed on
Sep 23, 2010
Sold by
Sequeira John K
Bought by
Tri Counties Bank
Purchase Details
Closed on
Apr 30, 1998
Sold by
Addington Marlene C and Sequira John K
Bought by
Sequeira John K and Sequeira Marlene C
Home Financials for this Owner
Home Financials are based on the most recent Mortgage that was taken out on this home.
Original Mortgage
$35,300
Interest Rate
7.06%
Create a Home Valuation Report for This Property
The Home Valuation Report is an in-depth analysis detailing your home's value as well as a comparison with similar homes in the area
Home Values in the Area
Average Home Value in this Area
Purchase History
| Date | Buyer | Sale Price | Title Company |
|---|---|---|---|
| Rodriguez Gustavo | $150,000 | None Available | |
| Federal Home Loan Mortgage Corp | -- | None Available | |
| Tri Counties Bank | $165,000 | None Available | |
| Sequeira John K | -- | Northern Counties Title Ins |
Source: Public Records
Mortgage History
| Date | Status | Borrower | Loan Amount |
|---|---|---|---|
| Open | Rodriguez Gustavo | $146,197 | |
| Previous Owner | Sequeira John K | $35,300 |
Source: Public Records
Tax History
| Year | Tax Paid | Tax Assessment Tax Assessment Total Assessment is a certain percentage of the fair market value that is determined by local assessors to be the total taxable value of land and additions on the property. | Land | Improvement |
|---|---|---|---|---|
| 2025 | $2,239 | $192,162 | $44,833 | $147,329 |
| 2024 | $2,231 | $188,395 | $43,954 | $144,441 |
| 2023 | $2,182 | $184,702 | $43,093 | $141,609 |
| 2022 | $2,060 | $181,082 | $42,249 | $138,833 |
| 2021 | $2,042 | $177,532 | $41,421 | $136,111 |
| 2020 | $2,031 | $175,713 | $40,997 | $134,716 |
| 2019 | $1,999 | $172,269 | $40,194 | $132,075 |
| 2018 | $1,905 | $168,892 | $39,406 | $129,486 |
| 2017 | $1,865 | $165,582 | $38,634 | $126,948 |
| 2016 | $1,815 | $162,336 | $37,877 | $124,459 |
| 2015 | $1,782 | $159,899 | $37,309 | $122,590 |
| 2014 | $1,748 | $156,768 | $36,579 | $120,189 |
Source: Public Records
Map
Nearby Homes
- 517 Nordell Place
- 1430 Walnut Ave
- 814 Bogdanich Pkwy
- 600 Sears Dr
- 564 Millwood Dr
- 518 Bedfordshire Dr
- 250 E Las Palmas Ave Unit 13
- 538 Chesterfield Dr
- 617 Mansfield Dr
- 918 Cumbria Ln
- 737 Featherstone Dr
- 801 Chatham Ln
- 800 Chatham Ln
- 804 Chatham Ln
- 813 Chatham Ln
- 812 Chatham Ln
- 817 Chatham Ln
- 816 Chatham Ln
- 821 Chatham Ln
- 820 Chatham Ln
Your Personal Tour Guide
Ask me questions while you tour the home.