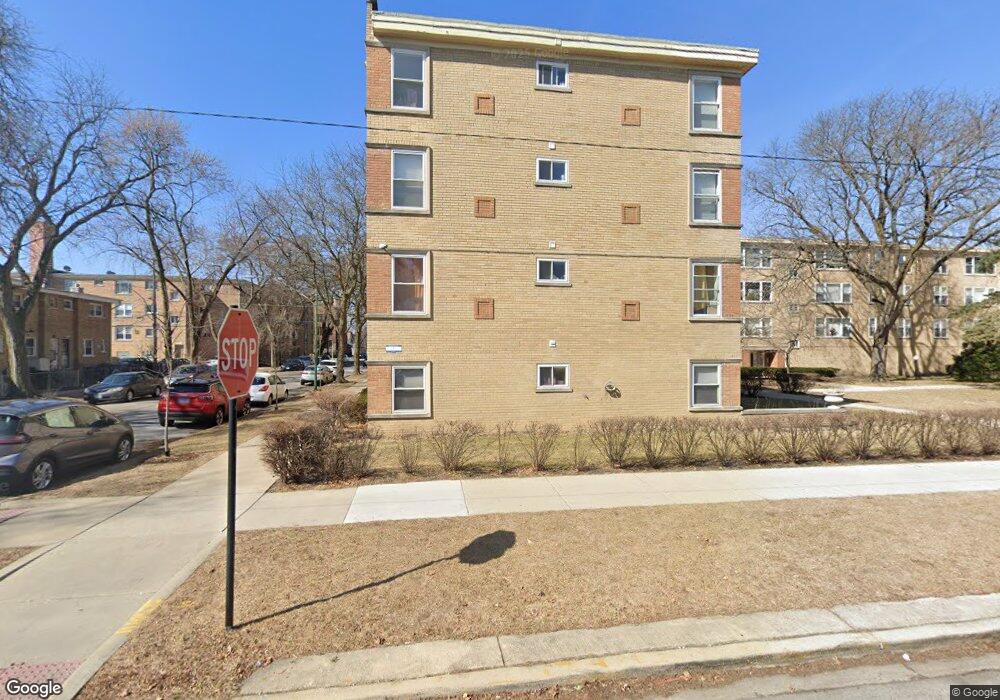
6100 N Winchester Ave Unit 6100 Chicago, IL 60660
West Ridge NeighborhoodEstimated Value: $109,000 - $193,000
--
Bed
--
Bath
--
Sq Ft
0.73
Acres
About This Home
This home is located at 6100 N Winchester Ave Unit 6100, Chicago, IL 60660 and is currently estimated at $157,892. 6100 N Winchester Ave Unit 6100 is a home located in Cook County with nearby schools including Hayt Elementary School, Senn High School, and Northside Catholic Academy.
Ownership History
Date
Name
Owned For
Owner Type
Purchase Details
Closed on
Jun 4, 2025
Sold by
Nissan Sabir and Butrus Nawal
Bought by
Butrus Nawal
Current Estimated Value
Purchase Details
Closed on
Aug 27, 2005
Sold by
Nissan Sabir and Cannon Naila K
Bought by
Nissan Sabir and Butrus Nawal
Home Financials for this Owner
Home Financials are based on the most recent Mortgage that was taken out on this home.
Original Mortgage
$34,000
Interest Rate
5.93%
Mortgage Type
Stand Alone Second
Purchase Details
Closed on
Nov 7, 2003
Sold by
Gurukambal Nazir Ahmed and Ahmed Vicky Hina
Bought by
Cannon Naila K and Nissan Sabir
Home Financials for this Owner
Home Financials are based on the most recent Mortgage that was taken out on this home.
Original Mortgage
$102,400
Interest Rate
5.37%
Mortgage Type
Purchase Money Mortgage
Create a Home Valuation Report for This Property
The Home Valuation Report is an in-depth analysis detailing your home's value as well as a comparison with similar homes in the area
Home Values in the Area
Average Home Value in this Area
Purchase History
| Date | Buyer | Sale Price | Title Company |
|---|---|---|---|
| Butrus Nawal | -- | None Listed On Document | |
| Nissan Sabir | -- | Cambridge Title Company | |
| Cannon Naila K | $128,000 | Atgf Inc |
Source: Public Records
Mortgage History
| Date | Status | Borrower | Loan Amount |
|---|---|---|---|
| Previous Owner | Nissan Sabir | $152,000 | |
| Previous Owner | Nissan Sabir | $34,000 | |
| Previous Owner | Nissan Sabir | $136,000 | |
| Previous Owner | Cannon Naila K | $30,230 | |
| Previous Owner | Cannon Naila K | $102,400 | |
| Previous Owner | Gurukambal Nazir A | $80,000 |
Source: Public Records
Tax History Compared to Growth
Tax History
| Year | Tax Paid | Tax Assessment Tax Assessment Total Assessment is a certain percentage of the fair market value that is determined by local assessors to be the total taxable value of land and additions on the property. | Land | Improvement |
|---|---|---|---|---|
| 2024 | $883 | $12,673 | $5,080 | $7,593 |
| 2023 | $839 | $7,500 | $3,750 | $3,750 |
| 2022 | $839 | $7,500 | $3,750 | $3,750 |
| 2021 | $838 | $7,499 | $3,750 | $3,749 |
| 2020 | $604 | $5,815 | $3,277 | $2,538 |
| 2019 | $615 | $6,492 | $3,277 | $3,215 |
| 2018 | $604 | $6,492 | $3,277 | $3,215 |
| 2017 | $270 | $4,630 | $2,785 | $1,845 |
| 2016 | $427 | $4,630 | $2,785 | $1,845 |
| 2015 | $368 | $4,630 | $2,785 | $1,845 |
| 2014 | $448 | $4,981 | $2,089 | $2,892 |
| 2013 | $595 | $5,900 | $2,089 | $3,811 |
Source: Public Records
Map
Nearby Homes
- 1958 W Norwood St Unit 4B
- 6108 N Damen Ave Unit 1E
- 1950 W Hood Ave Unit 4C
- 1960 W Hood Ave Unit 2C
- 1940 W Hood Ave Unit 4B
- 6030 N Winchester Ave Unit C
- 1921 W Hood Ave Unit 3B
- 6021 N Damen Ave Unit 202
- 6176 N Winchester Ave Unit 6176
- 1939 W Granville Ave Unit 1
- 1937 W Granville Ave Unit 1
- 1912 W Hood Ave Unit 1B
- 1910 W Hood Ave Unit GA
- 6121 N Hoyne Ave Unit 1S
- 6131 N Wolcott Ave
- 6149 N Wolcott Ave Unit 4D
- 1823 W Granville Ave Unit 4A
- 6227 N Ravenswood Ave
- 1748 W Granville Ave Unit 2A
- 6129 N Hermitage Ave
- 6100 N Winchester Ave Unit 1A
- 6100 N Winchester Ave Unit 6100
- 6100 N Winchester Ave Unit 6100
- 6100 N Winchester Ave Unit 6106
- 6100 N Winchester Ave Unit 6100
- 6100 N Winchester Ave Unit 6112
- 6100 N Winchester Ave Unit 6106
- 6100 N Winchester Ave Unit 6116
- 6100 N Winchester Ave Unit 6104
- 6100 N Winchester Ave Unit 6114
- 6100 N Winchester Ave Unit 6112
- 6100 N Winchester Ave Unit 6104
- 6100 N Winchester Ave Unit 6102
- 6100 N Winchester Ave Unit 6114
- 6100 N Winchester Ave Unit 6102
- 6100 N Winchester Ave Unit 6110
- 6100 N Winchester Ave Unit 6112
- 6100 N Winchester Ave Unit 6116
- 6100 N Winchester Ave Unit 6104
- 6100 N Winchester Ave Unit 6118