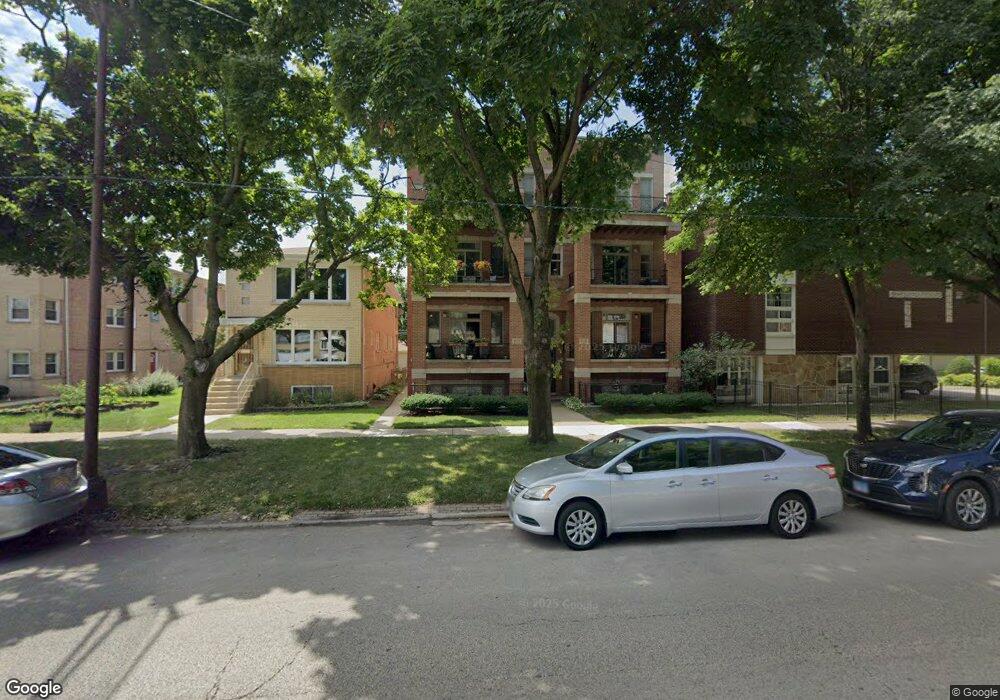
6113 W Higgins Ave Unit 61134 Chicago, IL 60630
Jefferson Park NeighborhoodEstimated Value: $266,000 - $421,000
3
Beds
2
Baths
1,400
Sq Ft
$243/Sq Ft
Est. Value
About This Home
This home is located at 6113 W Higgins Ave Unit 61134, Chicago, IL 60630 and is currently estimated at $340,340, approximately $243 per square foot. 6113 W Higgins Ave Unit 61134 is a home located in Cook County with nearby schools including Prussing Elementary School, Taft High School, and St. Constance School.
Ownership History
Date
Name
Owned For
Owner Type
Purchase Details
Closed on
Sep 25, 2022
Sold by
Odonnell Timothy and Odonnell Barbara
Bought by
Siota Cindy Roma
Current Estimated Value
Purchase Details
Closed on
May 15, 2018
Sold by
Gregorio Maria A
Bought by
Barbara O Donnell Timothy and Donnell Barbara O
Home Financials for this Owner
Home Financials are based on the most recent Mortgage that was taken out on this home.
Original Mortgage
$247,500
Interest Rate
5%
Mortgage Type
New Conventional
Purchase Details
Closed on
Oct 15, 2013
Sold by
Johnson Iver and Johnson Jennifer
Bought by
Gregorio Maria R
Home Financials for this Owner
Home Financials are based on the most recent Mortgage that was taken out on this home.
Original Mortgage
$172,000
Interest Rate
4.5%
Mortgage Type
New Conventional
Purchase Details
Closed on
Dec 28, 2001
Sold by
Odonnell Builders Llc
Bought by
Johnson Ivor
Create a Home Valuation Report for This Property
The Home Valuation Report is an in-depth analysis detailing your home's value as well as a comparison with similar homes in the area
Home Values in the Area
Average Home Value in this Area
Purchase History
| Date | Buyer | Sale Price | Title Company |
|---|---|---|---|
| Siota Cindy Roma | $310,000 | Chicago Title | |
| Barbara O Donnell Timothy | $275,000 | Proper Title Llc | |
| Gregorio Maria R | $215,000 | Heritage Title Company | |
| Johnson Ivor | $245,000 | -- |
Source: Public Records
Mortgage History
| Date | Status | Borrower | Loan Amount |
|---|---|---|---|
| Previous Owner | Barbara O Donnell Timothy | $247,500 | |
| Previous Owner | Gregorio Maria R | $172,000 | |
| Closed | Johnson Ivor | $0 |
Source: Public Records
Tax History Compared to Growth
Tax History
| Year | Tax Paid | Tax Assessment Tax Assessment Total Assessment is a certain percentage of the fair market value that is determined by local assessors to be the total taxable value of land and additions on the property. | Land | Improvement |
|---|---|---|---|---|
| 2024 | $4,855 | $30,666 | $2,471 | $28,195 |
| 2023 | $4,733 | $23,000 | $1,977 | $21,023 |
| 2022 | $4,733 | $23,000 | $1,977 | $21,023 |
| 2021 | $4,628 | $22,999 | $1,977 | $21,022 |
| 2020 | $5,100 | $22,879 | $1,235 | $21,644 |
| 2019 | $5,105 | $25,395 | $1,235 | $24,160 |
| 2018 | $4,340 | $25,395 | $1,235 | $24,160 |
| 2017 | $3,820 | $21,113 | $1,087 | $20,026 |
| 2016 | $3,731 | $21,113 | $1,087 | $20,026 |
| 2015 | $3,390 | $21,113 | $1,087 | $20,026 |
| 2014 | $4,092 | $24,608 | $1,037 | $23,571 |
| 2013 | $4,000 | $24,608 | $1,037 | $23,571 |
Source: Public Records
Map
Nearby Homes
- 5133 N Austin Ave
- 5000 N Mobile Ave
- 4886 N Austin Ave
- 5133 N Marmora Ave
- 5311 N Mcvicker Ave
- 5254 N Mason Ave
- 5148 N Monitor Ave Unit 301
- 6140 W Gunnison St Unit 3
- 5334 N Melvina Ave
- 6228 W Lawrence Ave
- 5915 W Gunnison St Unit 2F
- 5423 N Moody Ave
- 6316 W Lawrence Ave
- 6046 W Giddings St
- 5921 W Lawrence Ave
- 6137 W Giddings St
- 4824 N Natchez Ave
- 5705 W Higgins Ave
- 6420 W Gunnison St
- 6352 W Giddings St
- 6113 W Higgins Ave
- 6113 W Higgins Ave Unit 61133
- 6113 W Higgins Ave Unit 61131
- 6113 W Higgins Ave Unit 61132
- 6113 W Higgins Ave Unit 2E
- 6113 W Higgins Ave Unit 3E
- 6113 W Higgins Ave Unit 1
- 6113 W Higgins Ave Unit 2E
- 6113 W Higgins Ave Unit 4
- 6113 W Higgins Ave Unit GE
- 6115 W Higgins Ave Unit 61154
- 6115 W Higgins Ave Unit 61151
- 6115 W Higgins Ave Unit 61152
- 6115 W Higgins Ave Unit 61153
- 6115 W Higgins Ave Unit 3W
- 6115 W Higgins Ave Unit 1W
- 6115 W Higgins Ave Unit GW
- 6111 W Higgins Ave
- 6111 W Higgins Ave
- 6121 W Higgins Ave Unit B2