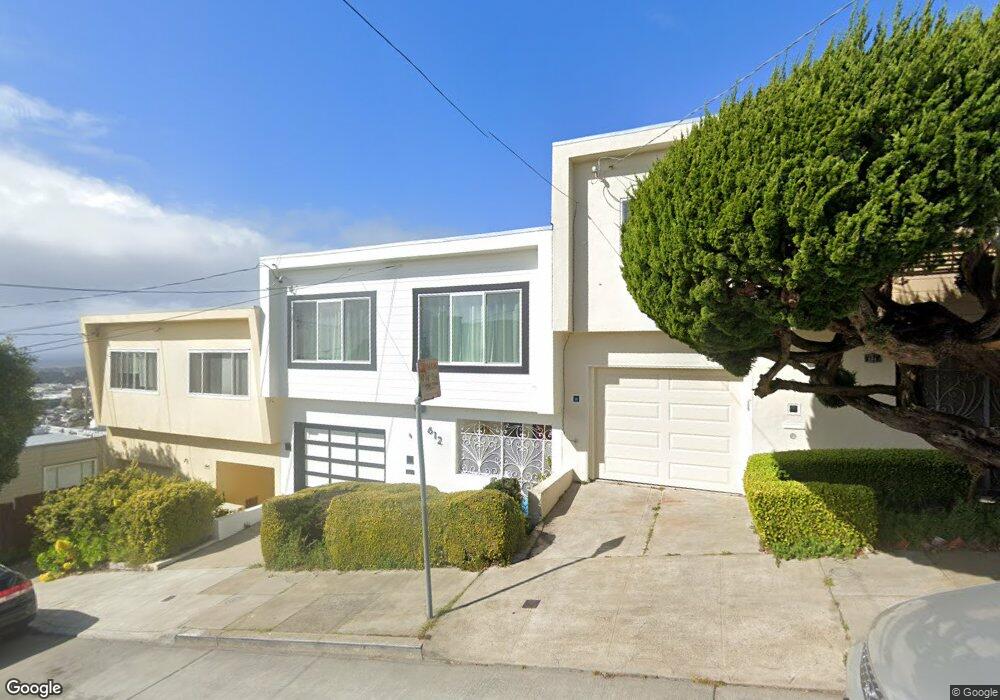
612 Shields St San Francisco, CA 94132
Merced Heights NeighborhoodEstimated Value: $998,000 - $1,315,000
3
Beds
1
Bath
1,151
Sq Ft
$1,068/Sq Ft
Est. Value
About This Home
This home is located at 612 Shields St, San Francisco, CA 94132 and is currently estimated at $1,228,842, approximately $1,067 per square foot. 612 Shields St is a home located in San Francisco County with nearby schools including Ortega (Jose) Elementary School, Aptos Middle School, and Krouzian-Zekarian-Vasbouragan Armenian School.
Ownership History
Date
Name
Owned For
Owner Type
Purchase Details
Closed on
Jul 21, 2023
Sold by
Meli T Brown Trust
Bought by
Coker Janet Ann
Current Estimated Value
Purchase Details
Closed on
Mar 23, 2017
Sold by
Brown Meli T
Bought by
Brown Meli T
Purchase Details
Closed on
Sep 18, 2006
Sold by
Hall Debra
Bought by
Brown Michael and Brown Meli
Home Financials for this Owner
Home Financials are based on the most recent Mortgage that was taken out on this home.
Original Mortgage
$67,700
Interest Rate
6.53%
Mortgage Type
Credit Line Revolving
Purchase Details
Closed on
Aug 16, 2002
Sold by
Lee Gladys
Bought by
Hall Debra
Home Financials for this Owner
Home Financials are based on the most recent Mortgage that was taken out on this home.
Original Mortgage
$325,500
Interest Rate
6.52%
Mortgage Type
Stand Alone First
Create a Home Valuation Report for This Property
The Home Valuation Report is an in-depth analysis detailing your home's value as well as a comparison with similar homes in the area
Home Values in the Area
Average Home Value in this Area
Purchase History
| Date | Buyer | Sale Price | Title Company |
|---|---|---|---|
| Coker Janet Ann | $950,000 | Wfg National Title | |
| Brown Meli T | -- | None Available | |
| Brown Michael | $677,000 | Old Republic Title Company | |
| Hall Debra | $465,000 | Fidelity National Title Co |
Source: Public Records
Mortgage History
| Date | Status | Borrower | Loan Amount |
|---|---|---|---|
| Previous Owner | Brown Michael | $67,700 | |
| Previous Owner | Brown Michael | $541,600 | |
| Previous Owner | Hall Debra | $325,500 |
Source: Public Records
Tax History Compared to Growth
Tax History
| Year | Tax Paid | Tax Assessment Tax Assessment Total Assessment is a certain percentage of the fair market value that is determined by local assessors to be the total taxable value of land and additions on the property. | Land | Improvement |
|---|---|---|---|---|
| 2025 | $11,447 | $928,028 | $544,214 | $383,814 |
| 2024 | $11,447 | $909,834 | $533,544 | $376,290 |
| 2023 | $11,271 | $891,996 | $523,083 | $368,913 |
| 2022 | $11,317 | $874,508 | $512,827 | $361,681 |
| 2021 | $11,140 | $857,362 | $502,772 | $354,590 |
| 2020 | $11,503 | $848,572 | $497,617 | $350,955 |
| 2019 | $10,538 | $831,935 | $487,860 | $344,075 |
| 2018 | $10,184 | $815,624 | $478,295 | $337,329 |
| 2017 | $9,766 | $799,632 | $468,917 | $330,715 |
| 2016 | $9,596 | $783,954 | $459,723 | $324,231 |
| 2015 | $9,477 | $772,180 | $452,818 | $319,362 |
| 2014 | $9,228 | $757,055 | $443,948 | $313,107 |
Source: Public Records
Map
Nearby Homes
- 621 Shields St
- 230 Ralston St
- 424 Garfield St
- 531 Arch St
- 532 Ramsell St
- 131 Beverly St
- 233 Sargent St
- 119 Vernon St
- 475 Head St
- 442 Bright St
- 20 Sargent St
- 274 Montana St
- 73 Summit Way
- 118 Summit Way
- 114 Saint Charles Ave
- 150 Chester Ave
- 914 Capitol Ave
- 8100 Oceanview Terrace Unit 112
- 337 Jules Ave
- 8400 Oceanview Terrace Unit 305