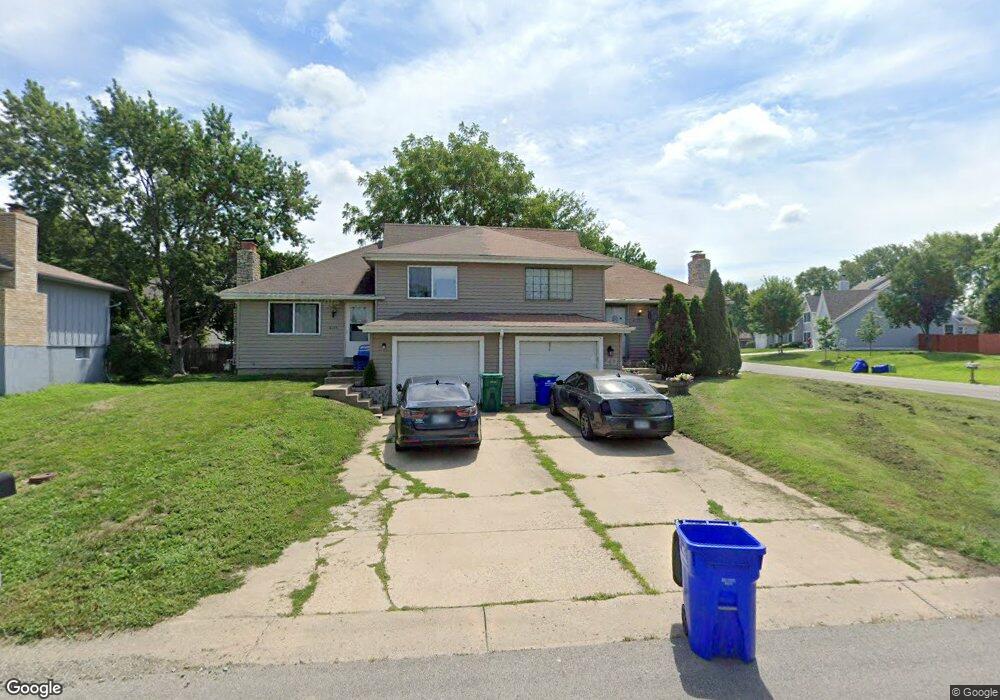
6123 Bradshaw St Shawnee, KS 66216
Estimated Value: $238,000 - $321,000
2
Beds
2
Baths
840
Sq Ft
$311/Sq Ft
Est. Value
About This Home
This home is located at 6123 Bradshaw St, Shawnee, KS 66216 and is currently estimated at $261,470, approximately $311 per square foot. 6123 Bradshaw St is a home located in Johnson County with nearby schools including Ray Marsh Elementary School, Trailridge Middle School, and Shawnee Mission Northwest High School.
Ownership History
Date
Name
Owned For
Owner Type
Purchase Details
Closed on
Oct 14, 2020
Sold by
Karra Jasraj S and Kaur Rajwant
Bought by
Mercantile Properties
Current Estimated Value
Purchase Details
Closed on
Apr 17, 2008
Sold by
Karra Jasraj S
Bought by
Karra Jasraj S and Kaur Rajawant
Home Financials for this Owner
Home Financials are based on the most recent Mortgage that was taken out on this home.
Original Mortgage
$77,500
Interest Rate
5.89%
Mortgage Type
New Conventional
Purchase Details
Closed on
Oct 17, 2005
Sold by
Singh Jagraj and Singh Ravinder
Bought by
Karra Jasraj S
Home Financials for this Owner
Home Financials are based on the most recent Mortgage that was taken out on this home.
Original Mortgage
$148,000
Interest Rate
5.69%
Mortgage Type
New Conventional
Create a Home Valuation Report for This Property
The Home Valuation Report is an in-depth analysis detailing your home's value as well as a comparison with similar homes in the area
Home Values in the Area
Average Home Value in this Area
Purchase History
| Date | Buyer | Sale Price | Title Company |
|---|---|---|---|
| Mercantile Properties | -- | Clear Title Nationwide Inc | |
| Mercantile Properties | -- | Clear Title | |
| Karra Jasraj S | -- | Chicago Title Ins Co | |
| Karra Jasraj S | -- | Commonwealth Title |
Source: Public Records
Mortgage History
| Date | Status | Borrower | Loan Amount |
|---|---|---|---|
| Previous Owner | Karra Jasraj S | $77,500 | |
| Previous Owner | Karra Jasraj S | $148,000 |
Source: Public Records
Tax History Compared to Growth
Tax History
| Year | Tax Paid | Tax Assessment Tax Assessment Total Assessment is a certain percentage of the fair market value that is determined by local assessors to be the total taxable value of land and additions on the property. | Land | Improvement |
|---|---|---|---|---|
| 2024 | $2,191 | $21,149 | $3,294 | $17,855 |
| 2023 | $1,371 | $12,938 | $3,134 | $9,804 |
| 2022 | $1,157 | $10,879 | $2,849 | $8,030 |
| 2021 | $1,107 | $9,499 | $2,591 | $6,908 |
| 2020 | $1,845 | $15,767 | $2,352 | $13,415 |
| 2019 | $1,857 | $15,870 | $2,137 | $13,733 |
| 2018 | $1,714 | $14,571 | $2,137 | $12,434 |
| 2017 | $1,076 | $8,924 | $1,903 | $7,021 |
| 2016 | $1,500 | $12,374 | $1,903 | $10,471 |
| 2015 | $1,251 | $10,856 | $1,903 | $8,953 |
| 2013 | -- | $9,568 | $1,903 | $7,665 |
Source: Public Records
Map
Nearby Homes
- 4908 Noland Rd
- 5919 Pflumm Rd
- 5807 Noland Rd
- 12809 W 57th Terrace
- 12116 W 63rd Terrace
- 6145 Park St
- 6143 Park St
- 12225 W 64th Terrace
- 5845 Caenen St
- 12914 W 67th St
- 13415 W 66th Terrace
- 6556 Charles St
- 6564 Charles St
- 6640 Pflumm Rd
- 11928 W 66th St
- 6610 Halsey St
- 5703 Cottonwood St
- 5620 Monrovia St
- 14204 W 63rd St
- 12508 W 56th St
- 6119 Bradshaw St
- 6125 Bradshaw St
- 6117 Bradshaw St
- 6118 Parkhill St
- 6122 Parkhill St
- 6114 Parkhill St
- 6124 Bradshaw St
- 6111 Bradshaw St
- 6126 Bradshaw St
- 6118 Bradshaw St
- 12903 W 61st Terrace
- 12833 W 61st Terrace
- 12831 W 61st Terrace
- 12901 W 61st Terrace
- 6112 Bradshaw St
- 12825 W 61st Terrace
- 6110 Parkhill St
- 12914 W 61st Terrace
- 12907 W 61st Terrace
- 12903 W 61st St