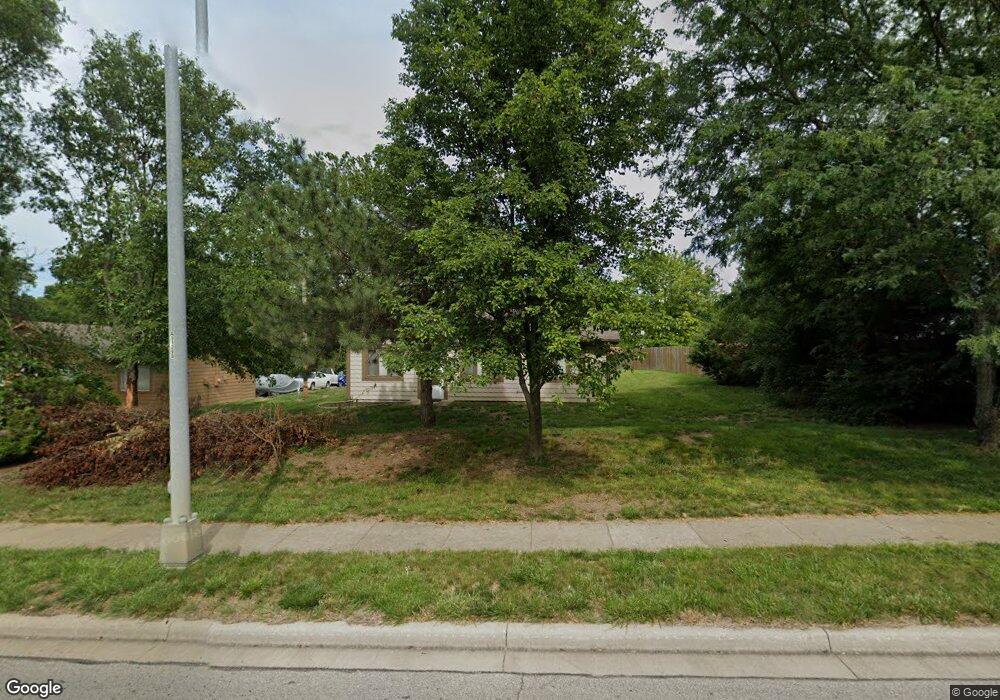
613 N Cherry St Olathe, KS 66061
Estimated Value: $234,468 - $242,000
2
Beds
1
Bath
864
Sq Ft
$276/Sq Ft
Est. Value
About This Home
This home is located at 613 N Cherry St, Olathe, KS 66061 and is currently estimated at $238,117, approximately $275 per square foot. 613 N Cherry St is a home located in Johnson County with nearby schools including Northview Elementary School, Santa Fe Trail Middle School, and Olathe North Sr High School.
Ownership History
Date
Name
Owned For
Owner Type
Purchase Details
Closed on
Jan 7, 2021
Sold by
John Norris Foundation Specialists Llc
Bought by
John Norris Investments Llc
Current Estimated Value
Purchase Details
Closed on
Nov 2, 2020
Sold by
The Kolkin Group Llc
Bought by
John Norris Foundation Specialists Llc
Home Financials for this Owner
Home Financials are based on the most recent Mortgage that was taken out on this home.
Original Mortgage
$140,000
Interest Rate
2.9%
Mortgage Type
New Conventional
Purchase Details
Closed on
Jun 16, 2016
Sold by
Rice Stephen and Rice Michelle
Bought by
Kolkin Group Llc
Purchase Details
Closed on
Jun 26, 2007
Sold by
Sheddrick Terry
Bought by
Rice Stephen
Home Financials for this Owner
Home Financials are based on the most recent Mortgage that was taken out on this home.
Original Mortgage
$9,180
Interest Rate
6.19%
Mortgage Type
Stand Alone Second
Create a Home Valuation Report for This Property
The Home Valuation Report is an in-depth analysis detailing your home's value as well as a comparison with similar homes in the area
Home Values in the Area
Average Home Value in this Area
Purchase History
| Date | Buyer | Sale Price | Title Company |
|---|---|---|---|
| John Norris Investments Llc | -- | None Listed On Document | |
| John Norris Investments Llc | -- | None Listed On Document | |
| John Norris Foundation Specialists Llc | -- | Superior Title | |
| Kolkin Group Llc | -- | Continental Title | |
| Rice Stephen | -- | Continental Title Company |
Source: Public Records
Mortgage History
| Date | Status | Borrower | Loan Amount |
|---|---|---|---|
| Previous Owner | John Norris Foundation Specialists Llc | $140,000 | |
| Previous Owner | Rice Stephen | $9,180 | |
| Previous Owner | Rice Stephen | $73,440 |
Source: Public Records
Tax History
| Year | Tax Paid | Tax Assessment Tax Assessment Total Assessment is a certain percentage of the fair market value that is determined by local assessors to be the total taxable value of land and additions on the property. | Land | Improvement |
|---|---|---|---|---|
| 2025 | $2,455 | $24,541 | $5,075 | $19,466 |
| 2024 | $2,455 | $22,564 | $4,612 | $17,952 |
| 2023 | $2,404 | $21,367 | $4,194 | $17,173 |
| 2022 | $1,997 | $17,365 | $3,811 | $13,554 |
| 2021 | $2,152 | $17,583 | $3,811 | $13,772 |
| 2020 | $2,094 | $16,962 | $3,313 | $13,649 |
| 2019 | $2,065 | $16,617 | $3,313 | $13,304 |
| 2018 | $1,890 | $15,134 | $2,653 | $12,481 |
| 2017 | $1,716 | $13,627 | $2,653 | $10,974 |
| 2016 | $1,483 | $12,121 | $2,653 | $9,468 |
| 2015 | $1,398 | $11,454 | $2,653 | $8,801 |
| 2013 | -- | $10,545 | $2,410 | $8,135 |
Source: Public Records
Map
Nearby Homes
- 435 N Chestnut St
- 709 N Woodland St
- 525 N Stevenson St
- 625 N Stevenson St
- 612 N Logan St
- 725 N Hamilton St
- 524 E Prairie St
- 900 N Walker Ln
- 12683 S Belford St
- 1010 N Clinton St
- 1051 W Ashbury St
- 578 W Loula St
- 1024 N Marion St
- 573 W Loula St
- 316 W Elm St
- 563 E Park St
- 308 S Stevenson St
- 20952 W 125th Terrace
- 313 S Walker St
- 401 S Harrison St
- 617 N Cherry St
- 150 W Mulberry St
- 140 W Mulberry St
- 160 W Mulberry St
- 611 N Cherry St
- 621 N Cherry St
- 605 N Cherry St
- 615 N Cherry St
- 619 N Cherry St
- 601 N Cherry St
- 625 N Cherry St
- 108 E Mulberry St
- 629 N Cherry St
- 115 W Mulberry St
- 125 W Mulberry St
- 116 E Mulberry St
- 132 E Mulberry St
- 616 N Willie St
- 618 N Willie St
- 622 N Willie St
Your Personal Tour Guide
Ask me questions while you tour the home.