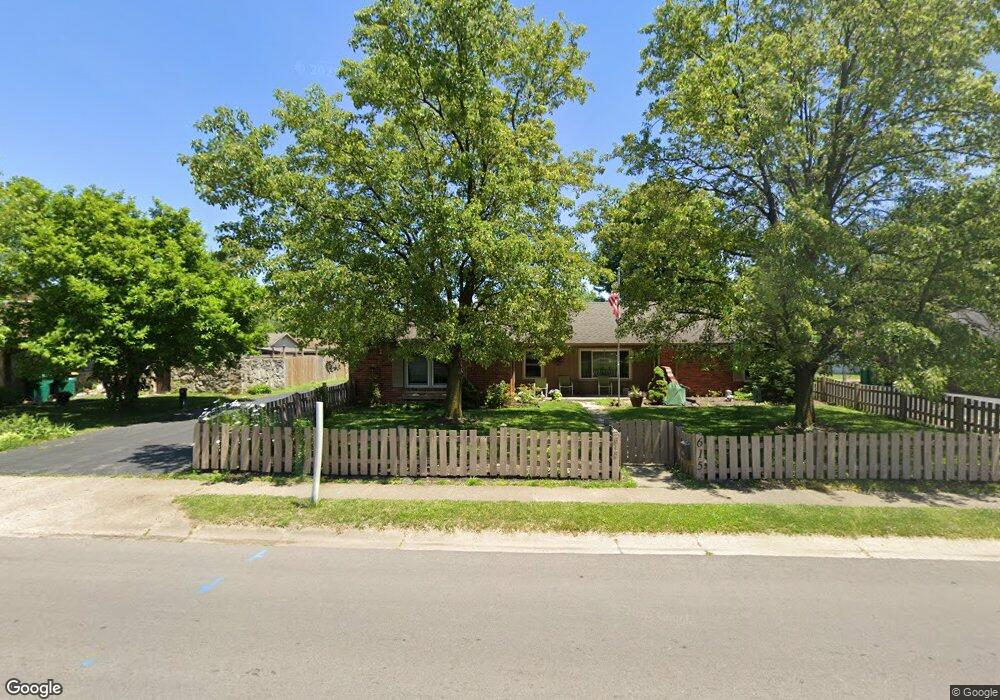
613 Simmons St Plainfield, IN 46168
Estimated Value: $304,000 - $339,000
4
Beds
2
Baths
1,983
Sq Ft
$161/Sq Ft
Est. Value
About This Home
This home is located at 613 Simmons St, Plainfield, IN 46168 and is currently estimated at $318,842, approximately $160 per square foot. 613 Simmons St is a home located in Hendricks County with nearby schools including Brentwood Elementary School, Plainfield Community Middle School, and Plainfield High School.
Ownership History
Date
Name
Owned For
Owner Type
Purchase Details
Closed on
Jul 2, 2024
Sold by
Pierce Christopher J
Bought by
Pierce Revocable Trust and Pierce
Current Estimated Value
Purchase Details
Closed on
Jun 29, 2017
Sold by
Collins Lori R
Bought by
Pierce Christopher J
Home Financials for this Owner
Home Financials are based on the most recent Mortgage that was taken out on this home.
Original Mortgage
$209,000
Interest Rate
3.95%
Mortgage Type
New Conventional
Purchase Details
Closed on
Mar 30, 2016
Sold by
Collins James R
Bought by
Collins Lori R
Purchase Details
Closed on
Oct 12, 2006
Sold by
Mills Jo Ellen
Bought by
Collins James R and Collins Lori R
Create a Home Valuation Report for This Property
The Home Valuation Report is an in-depth analysis detailing your home's value as well as a comparison with similar homes in the area
Home Values in the Area
Average Home Value in this Area
Purchase History
| Date | Buyer | Sale Price | Title Company |
|---|---|---|---|
| Pierce Revocable Trust | -- | None Listed On Document | |
| Pierce Christopher J | $220,000 | First American Title | |
| Collins Lori R | -- | Royal Title | |
| Collins James R | -- | None Available |
Source: Public Records
Mortgage History
| Date | Status | Borrower | Loan Amount |
|---|---|---|---|
| Previous Owner | Pierce Christopher J | $209,000 |
Source: Public Records
Tax History
| Year | Tax Paid | Tax Assessment Tax Assessment Total Assessment is a certain percentage of the fair market value that is determined by local assessors to be the total taxable value of land and additions on the property. | Land | Improvement |
|---|---|---|---|---|
| 2024 | $2,894 | $291,900 | $35,300 | $256,600 |
| 2023 | $4,013 | $277,800 | $33,500 | $244,300 |
| 2022 | $2,647 | $264,700 | $31,800 | $232,900 |
| 2021 | $2,296 | $232,000 | $31,800 | $200,200 |
| 2020 | $2,297 | $231,600 | $31,800 | $199,800 |
| 2019 | $2,194 | $225,800 | $30,800 | $195,000 |
| 2018 | $2,219 | $222,600 | $30,800 | $191,800 |
| 2017 | $1,567 | $166,200 | $27,100 | $139,100 |
| 2016 | $1,466 | $159,000 | $27,100 | $131,900 |
| 2014 | $1,928 | $159,500 | $26,900 | $132,600 |
Source: Public Records
Map
Nearby Homes
- 407 Dunn St
- 2668 Marjorie Ln
- 800 Walton Dr
- 324 Holiday Dr
- 1713 Sycamore Dr
- 911 Gary Dr
- 228 Shaw St
- 2394 Eagle Ave
- 2198 Galleone Way
- 7683 Fairwood Blvd
- 303 Green St
- 329 Avon Ave
- 214 N Vine St
- 1710 Beechwood Dr
- 980 Andico Rd
- 1429 Blackthorne Trail N
- 504 Magnolia Dr
- 1219 Independence Blvd
- 2644 Prism Way
- 2654 Prism Way
- 615 Simmons St
- 619 Simmons St
- 605 Simmons St
- 1143 Raymond St Unit 1145
- 614 Kentucky Ave
- 621 Simmons St
- 621 Simmons St
- 618 Kentucky Ave
- 1147 Raymond St Unit 1149
- 622 Kentucky Ave
- 533 Simmons St
- 534 Simmons St
- 625 Simmons St Unit 627
- 624 Kentucky Ave
- 534 Kentucky Ave
- 529 Simmons St
- 530 Simmons St
- 1020 Raymond St
Your Personal Tour Guide
Ask me questions while you tour the home.