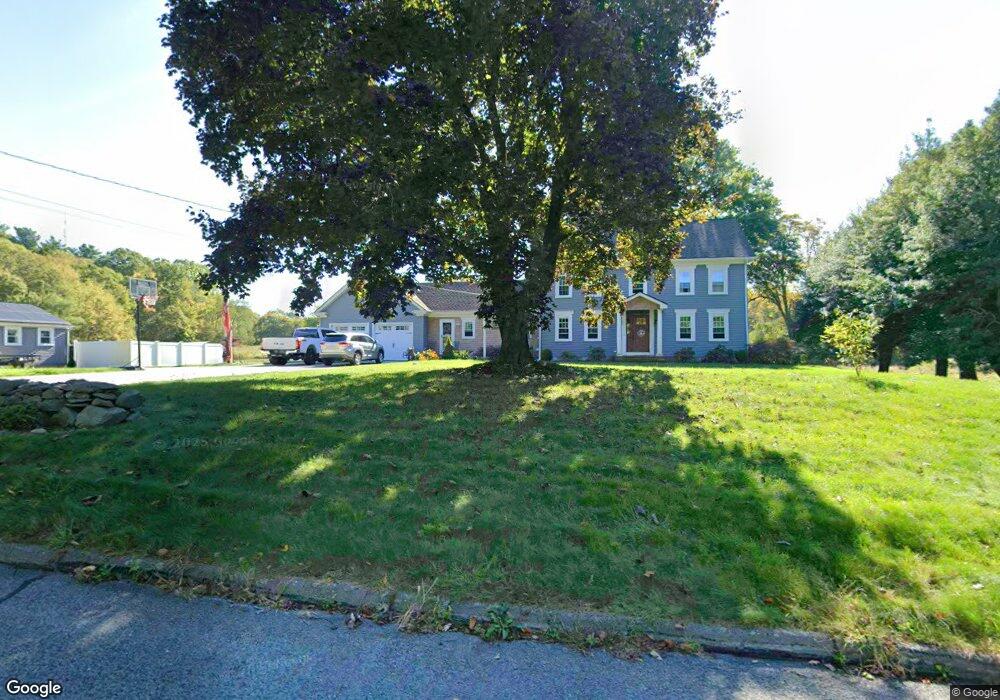
615 Read St Seekonk, MA 02771
Estimated Value: $1,019,000 - $1,049,000
3
Beds
3
Baths
2,932
Sq Ft
$353/Sq Ft
Est. Value
About This Home
This home is located at 615 Read St, Seekonk, MA 02771 and is currently estimated at $1,035,707, approximately $353 per square foot. 615 Read St is a home located in Bristol County with nearby schools including Seekonk High School, St Margaret School, and The Wolf School.
Ownership History
Date
Name
Owned For
Owner Type
Purchase Details
Closed on
Nov 4, 2024
Sold by
Jones Gary M
Bought by
Jones Lt and Jones
Current Estimated Value
Purchase Details
Closed on
Mar 17, 2017
Sold by
Turner Ft and Turner
Bought by
Jones Gary M
Purchase Details
Closed on
Aug 29, 2013
Sold by
Turner Ft and Turner
Bought by
Jones Nathanael J
Create a Home Valuation Report for This Property
The Home Valuation Report is an in-depth analysis detailing your home's value as well as a comparison with similar homes in the area
Home Values in the Area
Average Home Value in this Area
Purchase History
| Date | Buyer | Sale Price | Title Company |
|---|---|---|---|
| Jones Lt | -- | None Available | |
| Jones Lt | -- | None Available | |
| Jones Gary M | -- | -- | |
| Jones Gary M | -- | -- | |
| Jones Nathanael J | -- | -- | |
| Jones Nathanael J | -- | -- |
Source: Public Records
Tax History
| Year | Tax Paid | Tax Assessment Tax Assessment Total Assessment is a certain percentage of the fair market value that is determined by local assessors to be the total taxable value of land and additions on the property. | Land | Improvement |
|---|---|---|---|---|
| 2025 | $0 | $835,800 | $256,300 | $579,500 |
| 2024 | $11,667 | $801,900 | $256,300 | $545,600 |
| 2023 | $0 | $763,900 | $256,300 | $507,600 |
| 2022 | $11,667 | $874,600 | $436,200 | $438,400 |
| 2021 | $11,601 | $854,900 | $418,300 | $436,600 |
| 2020 | $10,362 | $786,800 | $418,500 | $368,300 |
| 2019 | $9,397 | $719,500 | $411,000 | $308,500 |
| 2018 | $9,003 | $674,400 | $406,700 | $267,700 |
| 2017 | $8,901 | $661,300 | $403,000 | $258,300 |
| 2016 | $8,967 | $668,700 | $403,000 | $265,700 |
| 2015 | $8,646 | $653,500 | $403,000 | $250,500 |
Source: Public Records
Map
Nearby Homes
- 377 Read St
- 16 Salisbury St
- 660 Pine St
- 52 Walker St
- 2 Rod Way
- 149 Broad St
- 1150 Newman Ave
- 50 Dexter Ave
- 23 Colonial Way
- 15 Hickory Ridge Rd
- 6 Running Stream Rd
- 245 Manton St
- 91 Seabiscuit Place
- 108 Homestead Ave
- 14 Field St
- 242 Manton #41 St
- 242 Manton St
- 16 Matt's Way
- 8 Matt's Way
- 31 Woodland Way
Your Personal Tour Guide
Ask me questions while you tour the home.