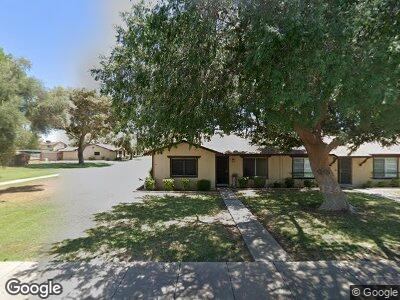
6159 N 31st Ave Phoenix, AZ 85017
Grandview NeighborhoodEstimated Value: $198,002 - $248,000
--
Bed
2
Baths
1,298
Sq Ft
$176/Sq Ft
Est. Value
About This Home
This home is located at 6159 N 31st Ave, Phoenix, AZ 85017 and is currently estimated at $229,001, approximately $176 per square foot. 6159 N 31st Ave is a home located in Maricopa County with nearby schools including Palo Verde Middle School, Ocotillo Elementary School, and Washington High School.
Ownership History
Date
Name
Owned For
Owner Type
Purchase Details
Closed on
Mar 23, 2021
Sold by
Bush John A and Bush Lizzie A
Bought by
Johnson Lizzie A and Bush John A
Current Estimated Value
Home Financials for this Owner
Home Financials are based on the most recent Mortgage that was taken out on this home.
Original Mortgage
$130,000
Outstanding Balance
$22,916
Interest Rate
2.73%
Mortgage Type
Stand Alone First
Estimated Equity
$206,085
Purchase Details
Closed on
Apr 17, 2017
Sold by
Pinson Kathleen L
Bought by
Bush John A
Home Financials for this Owner
Home Financials are based on the most recent Mortgage that was taken out on this home.
Original Mortgage
$91,829
Interest Rate
4.08%
Purchase Details
Closed on
Jun 8, 1999
Sold by
George William C
Bought by
Pinson Kathleen Louise
Purchase Details
Closed on
Jul 31, 1997
Sold by
Miller Betty J
Bought by
George William C and George Iris J
Create a Home Valuation Report for This Property
The Home Valuation Report is an in-depth analysis detailing your home's value as well as a comparison with similar homes in the area
Home Values in the Area
Average Home Value in this Area
Purchase History
| Date | Buyer | Sale Price | Title Company |
|---|---|---|---|
| Johnson Lizzie A | -- | Stewart Title | |
| Bush John A | $95,000 | -- | |
| Pinson Kathleen Louise | -- | -- | |
| George William C | $49,000 | Transnation Title Ins Co |
Source: Public Records
Mortgage History
| Date | Status | Borrower | Loan Amount |
|---|---|---|---|
| Open | Johnson Lizzie A | $130,000 | |
| Previous Owner | Bush John A | $107,855 | |
| Previous Owner | Bush John A | $91,829 | |
| Previous Owner | Bush John A | -- |
Source: Public Records
Tax History Compared to Growth
Tax History
| Year | Tax Paid | Tax Assessment Tax Assessment Total Assessment is a certain percentage of the fair market value that is determined by local assessors to be the total taxable value of land and additions on the property. | Land | Improvement |
|---|---|---|---|---|
| 2025 | $474 | $4,421 | -- | -- |
| 2024 | $465 | $4,211 | -- | -- |
| 2023 | $465 | $16,250 | $3,250 | $13,000 |
| 2022 | $448 | $12,270 | $2,450 | $9,820 |
| 2021 | $459 | $11,510 | $2,300 | $9,210 |
| 2020 | $447 | $10,010 | $2,000 | $8,010 |
| 2019 | $439 | $7,580 | $1,510 | $6,070 |
| 2018 | $427 | $6,110 | $1,220 | $4,890 |
| 2017 | $425 | $5,360 | $1,070 | $4,290 |
| 2016 | $474 | $4,780 | $950 | $3,830 |
| 2015 | $439 | $4,950 | $990 | $3,960 |
Source: Public Records
Map
Nearby Homes
- 6120 N 30th Ave
- 6101 N 31st Dr
- 6139 N 31st Dr
- 2911 W Keim Dr
- 2910 W Rose Ln
- 2904 W Cavalier Dr
- 2937 W Bethany Home Rd
- 6018 N 32nd Ave
- 6320 N 30th Dr
- 2914 W Marlette Ave
- 3018 W Rancho Dr
- 5753 N 31st Ln
- 6011 N 33rd Ave
- 2905 W Stella Ln
- 2829 W Marlette Ave
- 2729 W Keim Dr
- 3226 W Maryland Ave
- 3125 W Mclellan Blvd
- 6130 N 27th Ave
- 3107 W Tuckey Ln
- 6159 N 31st Ave
- 6157 N 31st Ave
- 6155 N 31st Ave
- 6153 N 31st Ave
- 3037 W Rose Ln
- 6151 N 31st Ave
- 3027 W Rose Ln
- 3029 W Rose Ln
- 3041 W Rose Ln
- 3031 W Rose Ln
- 3039 W Rose Ln
- 3033 W Rose Ln
- 6147 N 31st Ave
- 3043 W Rose Ln
- 6149 N 31st Ave
- 6149 N 31st Ave
- 6143 N 31st Ave
- 6145 N 31st Ave
- 3025 W Rose Ln
- 3035 W Rose Ln