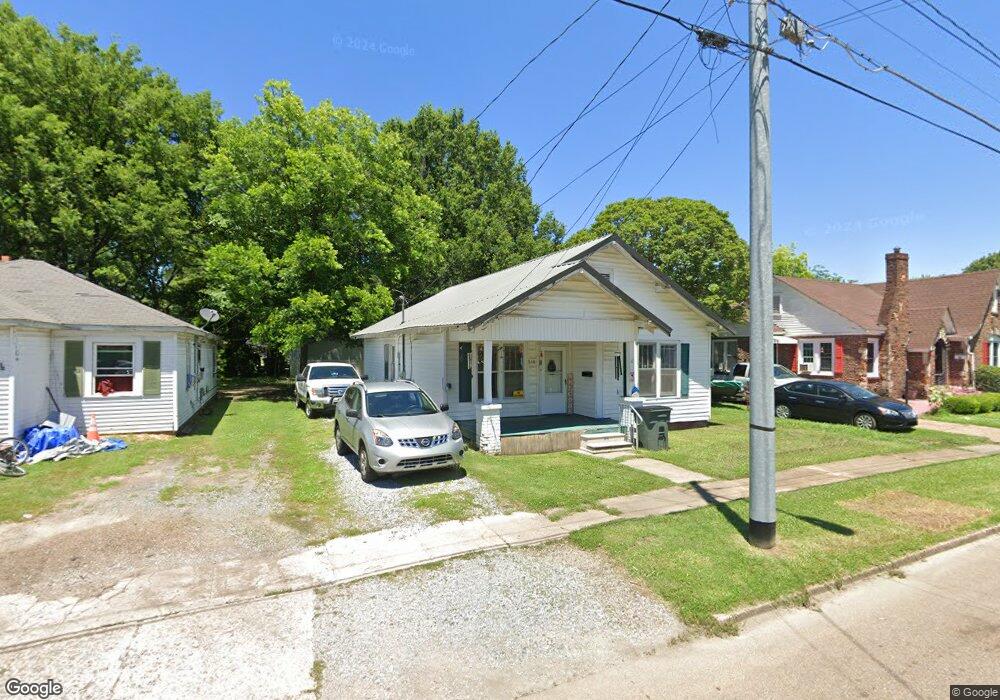
616 E Cheatham St Union City, TN 38261
Estimated Value: $46,000 - $117,000
--
Bed
1
Bath
1,064
Sq Ft
$64/Sq Ft
Est. Value
About This Home
This home is located at 616 E Cheatham St, Union City, TN 38261 and is currently estimated at $68,172, approximately $64 per square foot. 616 E Cheatham St is a home located in Obion County with nearby schools including Union City Elementary School, Union City Middle School, and Union City High School.
Ownership History
Date
Name
Owned For
Owner Type
Purchase Details
Closed on
Aug 1, 2018
Sold by
Jones James Miller
Bought by
Jones James Miller and Sasser Jones Barbara
Current Estimated Value
Purchase Details
Closed on
Jun 7, 2007
Bought by
Jones Jimmy M
Purchase Details
Closed on
Mar 22, 2007
Bought by
Household Mortgage
Purchase Details
Closed on
Nov 1, 2004
Bought by
Fitzgerald Donnie and Fitzgerald Regina
Purchase Details
Closed on
Dec 14, 2001
Sold by
Russ Thomas
Bought by
Ward Jerry G
Purchase Details
Closed on
Oct 25, 1996
Sold by
Velma Bridges
Bought by
Butch Holcombe
Purchase Details
Closed on
Jun 28, 1996
Sold by
Teddy Potter
Bought by
Velma Bridges
Purchase Details
Closed on
Jun 2, 1996
Sold by
Teddy Potter
Bought by
Teddy Potter
Purchase Details
Closed on
Jun 1, 1996
Sold by
Teddy Potter
Bought by
T & L Properties
Purchase Details
Closed on
Jan 4, 1994
Bought by
Potter Teddy
Purchase Details
Closed on
Jan 27, 1987
Bought by
Bridges Velma and Frank Arnold
Purchase Details
Closed on
Mar 28, 1986
Bought by
Long Billy W
Create a Home Valuation Report for This Property
The Home Valuation Report is an in-depth analysis detailing your home's value as well as a comparison with similar homes in the area
Home Values in the Area
Average Home Value in this Area
Purchase History
| Date | Buyer | Sale Price | Title Company |
|---|---|---|---|
| Jones James Miller | -- | -- | |
| Jones Jimmy M | $18,000 | -- | |
| Household Mortgage | $13,500 | -- | |
| Fitzgerald Donnie | $45,000 | -- | |
| Ward Jerry G | $30,000 | -- | |
| Butch Holcombe | $21,000 | -- | |
| Velma Bridges | -- | -- | |
| Teddy Potter | -- | -- | |
| T & L Properties | $15,000 | -- | |
| Potter Teddy | -- | -- | |
| Bridges Velma | -- | -- | |
| Long Billy W | -- | -- |
Source: Public Records
Tax History Compared to Growth
Tax History
| Year | Tax Paid | Tax Assessment Tax Assessment Total Assessment is a certain percentage of the fair market value that is determined by local assessors to be the total taxable value of land and additions on the property. | Land | Improvement |
|---|---|---|---|---|
| 2025 | -- | $14,500 | $0 | $0 |
| 2024 | -- | $13,825 | $1,400 | $12,425 |
| 2023 | $387 | $13,825 | $1,400 | $12,425 |
| 2022 | $147 | $9,200 | $2,200 | $7,000 |
| 2021 | $144 | $9,200 | $2,200 | $7,000 |
| 2020 | $147 | $9,200 | $2,200 | $7,000 |
| 2019 | $346 | $9,200 | $2,200 | $7,000 |
| 2018 | $344 | $9,300 | $2,200 | $7,100 |
| 2017 | $337 | $8,825 | $2,000 | $6,825 |
| 2016 | $337 | $8,825 | $2,000 | $6,825 |
| 2015 | $335 | $8,825 | $2,000 | $6,825 |
| 2014 | $335 | $8,825 | $2,000 | $6,825 |
Source: Public Records
Map
Nearby Homes
- 922 N Division St
- 1009 E Cheatham St
- 724 E Martin Luther King
- 501 N 1st St
- 841 Mosswood Dr
- 0 Mosswood Dr Unit RRA45928
- 0 Mosswood Dr Unit 44704
- 803 E Main St
- 1414 Forest Dr
- 817 Exchange St
- 903 Sherwood Dr
- 1449 Forest Dr
- 610 Perkins St
- 616 S 3rd St
- 605 S 5th St
- 901 S Home St
- 1813 E Vine St
- 633 E Jackson St
- 0 S Miles Ave Unit 41030
- 422-426 430 W Jackson St
- 614 E Cheatham St
- 624 E Cheatham St
- 612 E Cheatham St
- 626 E Cheatham St
- 621 E Todd St
- 613 E Todd St Unit 615
- 608 E Cheatham St
- 634 E Cheatham St
- 916 N Home St
- 604 E Cheatham St
- 615 E Cheatham St
- 621 E Cheatham St
- 917 N Morgan St
- 924 N Home St
- 609 E Cheatham St
- 633 E Cheatham St
- 700 E Cheatham St
- 603 E Cheatham St
- 703 E Todd St Unit 705
- 616 E Todd St