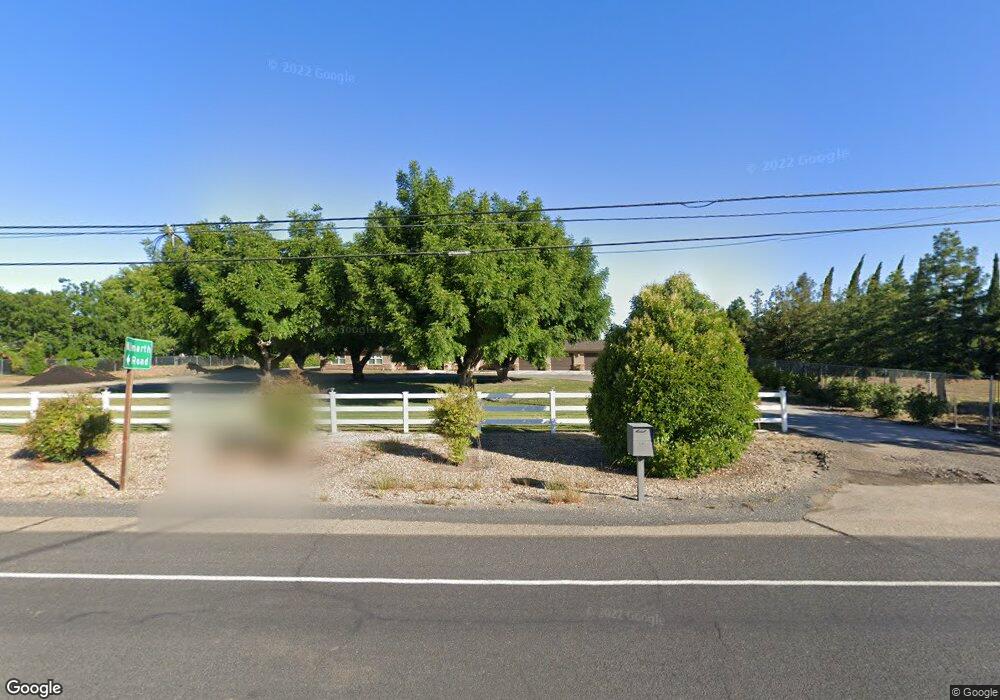
6161 Cherokee Rd Stockton, CA 95215
Estimated Value: $826,000 - $1,092,273
4
Beds
3
Baths
3,842
Sq Ft
$258/Sq Ft
Est. Value
About This Home
This home is located at 6161 Cherokee Rd, Stockton, CA 95215 and is currently estimated at $990,318, approximately $257 per square foot. 6161 Cherokee Rd is a home located in San Joaquin County with nearby schools including Waverly Elementary School and Linden High School.
Ownership History
Date
Name
Owned For
Owner Type
Purchase Details
Closed on
Apr 5, 2012
Sold by
Celli David Gregory and Celli Guadalupe Maria
Bought by
Celli David G and Celli Guadalupe M
Current Estimated Value
Purchase Details
Closed on
Jun 20, 2011
Sold by
Deutsche Bank National Trust Company
Bought by
Celli David Gregory and Celli Guadalupe Maria
Purchase Details
Closed on
Sep 3, 2010
Sold by
Altmann Ernest
Bought by
Deutsche Bank National Trust Company
Purchase Details
Closed on
Mar 4, 2010
Sold by
Altmann Ernest
Bought by
Creative Builders Inc
Purchase Details
Closed on
Aug 25, 2002
Sold by
Maria George D and Maria Charlene E
Bought by
Altmann Ernest
Home Financials for this Owner
Home Financials are based on the most recent Mortgage that was taken out on this home.
Original Mortgage
$367,200
Interest Rate
6.62%
Create a Home Valuation Report for This Property
The Home Valuation Report is an in-depth analysis detailing your home's value as well as a comparison with similar homes in the area
Home Values in the Area
Average Home Value in this Area
Purchase History
| Date | Buyer | Sale Price | Title Company |
|---|---|---|---|
| Celli David G | -- | None Available | |
| Celli David Gregory | $300,000 | Fidelity National Title Co | |
| Deutsche Bank National Trust Company | $477,000 | Accommodation | |
| Creative Builders Inc | -- | None Available | |
| Altmann Ernest | $459,500 | First American Title Co |
Source: Public Records
Mortgage History
| Date | Status | Borrower | Loan Amount |
|---|---|---|---|
| Previous Owner | Altmann Ernest | $367,200 | |
| Closed | Altmann Ernest | $91,800 |
Source: Public Records
Tax History Compared to Growth
Tax History
| Year | Tax Paid | Tax Assessment Tax Assessment Total Assessment is a certain percentage of the fair market value that is determined by local assessors to be the total taxable value of land and additions on the property. | Land | Improvement |
|---|---|---|---|---|
| 2025 | $7,859 | $664,225 | $144,441 | $519,784 |
| 2024 | $7,639 | $651,202 | $141,609 | $509,593 |
| 2023 | $7,544 | $638,434 | $138,833 | $499,601 |
| 2022 | $7,465 | $625,916 | $136,111 | $489,805 |
| 2021 | $7,381 | $613,644 | $133,443 | $480,201 |
| 2020 | $7,385 | $607,353 | $132,075 | $475,278 |
| 2019 | $7,278 | $595,445 | $129,486 | $465,959 |
| 2018 | $6,439 | $583,771 | $126,948 | $456,823 |
| 2017 | $6,308 | $572,325 | $124,459 | $447,866 |
| 2016 | $5,261 | $471,101 | $122,018 | $349,083 |
| 2014 | $3,896 | $342,388 | $117,832 | $224,556 |
Source: Public Records
Map
Nearby Homes
- 5835 Cherokee Rd Unit 61
- 5835 Cherokee Rd Unit 41
- 5835 Cherokee Rd Unit 7
- 0 Towers Place
- 3616 Towers Place
- 3514 N Cherryland Ave
- 4900 N 99 Frontage Rd Unit 232
- 5100 Hwy 99 Unit 128
- 4900 N Highway 99 Unit 106
- 4900 N Highway 99 Unit 65
- 4900 N Highway 99 Unit 190
- 4900 N Highway 99 Unit 56
- 3431 N Cherryland Ave Unit 50
- 3431 N Cherryland Ave Unit 55
- 4350 Cherokee Rd Unit 33
- 4350 Cherokee Rd Unit 42
- 5119 Foppiano Ln
- 4944 Manor Cir
- 5100 N Highway 99 Unit 8
- 5100 N Highway 99 Unit 83
- 6005 Cherokee Rd
- 6233 Cherokee Rd
- 6007 Cherokee Rd
- 6003 Cherokee Rd
- 4623 Lagorio Rd
- 6110 Leonardini Rd
- 6120 Cherokee Rd
- 5984 Leonardini Rd
- 6166 Leonardini Rd
- 4459 Wilmarth Rd
- 4701 Lagorio Rd
- 6182 Leonardini Rd
- 4610 Lagorio Rd
- 6132 Cherokee Rd
- 4440 Wilmarth Rd
- 5835 E Cherokee #69
- 4690 Lagorio Rd
- 5916 Leonardini Rd
- 4443 Wilmarth Rd
- 4750 Lagorio Rd