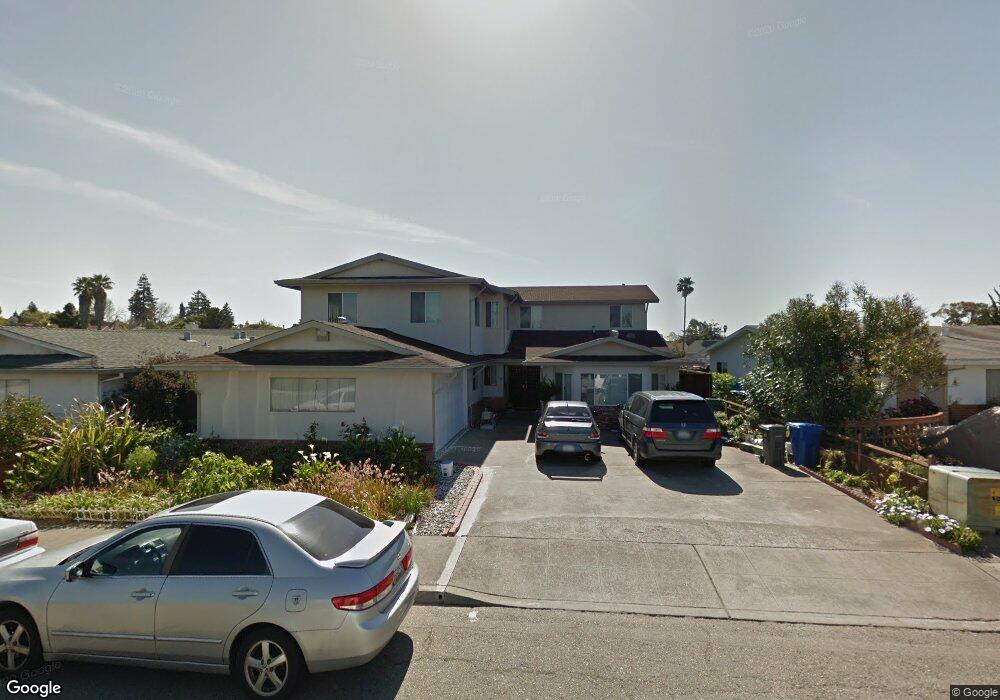
618 Tarryton Isle Alameda, CA 94501
South Shore NeighborhoodEstimated Value: $1,774,000 - $2,130,000
8
Beds
5
Baths
3,537
Sq Ft
$556/Sq Ft
Est. Value
About This Home
This home is located at 618 Tarryton Isle, Alameda, CA 94501 and is currently estimated at $1,967,867, approximately $556 per square foot. 618 Tarryton Isle is a home located in Alameda County with nearby schools including Franklin Elementary, Will C. Wood Middle School, and Encinal Junior/Senior High.
Ownership History
Date
Name
Owned For
Owner Type
Purchase Details
Closed on
Apr 11, 2006
Sold by
Yee Pamela and Mcphee William
Bought by
Yee Pamela
Current Estimated Value
Purchase Details
Closed on
Dec 31, 1996
Sold by
Yee Pamela
Bought by
Yee Pamela and Mcphee William
Purchase Details
Closed on
Jul 25, 1996
Sold by
Yeung Po Y
Bought by
Yee Pamela
Home Financials for this Owner
Home Financials are based on the most recent Mortgage that was taken out on this home.
Original Mortgage
$200,000
Outstanding Balance
$15,768
Interest Rate
8.18%
Estimated Equity
$1,952,099
Purchase Details
Closed on
Dec 10, 1993
Sold by
Ehrenpfort Stanley P and Ehrenpfort Carole J
Bought by
Yeung Po Yin
Home Financials for this Owner
Home Financials are based on the most recent Mortgage that was taken out on this home.
Original Mortgage
$256,000
Interest Rate
3.87%
Create a Home Valuation Report for This Property
The Home Valuation Report is an in-depth analysis detailing your home's value as well as a comparison with similar homes in the area
Home Values in the Area
Average Home Value in this Area
Purchase History
| Date | Buyer | Sale Price | Title Company |
|---|---|---|---|
| Yee Pamela | -- | None Available | |
| Yee Pamela | -- | -- | |
| Yee Pamela | $400,000 | First American Title Guarant | |
| Yeung Po Yin | $320,000 | Fidelity National Title |
Source: Public Records
Mortgage History
| Date | Status | Borrower | Loan Amount |
|---|---|---|---|
| Open | Yee Pamela | $200,000 | |
| Previous Owner | Yeung Po Yin | $256,000 | |
| Closed | Yeung Po Yin | $32,000 |
Source: Public Records
Tax History Compared to Growth
Tax History
| Year | Tax Paid | Tax Assessment Tax Assessment Total Assessment is a certain percentage of the fair market value that is determined by local assessors to be the total taxable value of land and additions on the property. | Land | Improvement |
|---|---|---|---|---|
| 2025 | $16,851 | $1,138,593 | $343,678 | $801,915 |
| 2024 | $16,851 | $1,116,133 | $336,940 | $786,193 |
| 2023 | $16,225 | $1,101,117 | $330,335 | $770,782 |
| 2022 | $15,874 | $1,072,530 | $323,859 | $755,671 |
| 2021 | $15,498 | $1,051,367 | $317,510 | $740,857 |
| 2020 | $15,318 | $1,047,520 | $314,256 | $733,264 |
| 2019 | $14,254 | $1,026,987 | $308,096 | $718,891 |
| 2018 | $13,900 | $1,006,857 | $302,057 | $704,800 |
| 2017 | $13,262 | $987,121 | $296,136 | $690,985 |
| 2016 | $13,292 | $967,771 | $290,331 | $677,440 |
| 2015 | $13,254 | $953,241 | $285,972 | $667,269 |
| 2014 | $12,599 | $934,571 | $280,371 | $654,200 |
Source: Public Records
Map
Nearby Homes
- 955 Shorepoint Ct Unit 110
- 955 Shorepoint Ct Unit 200
- 901 San Antonio Ave
- 950 Shorepoint Ct Unit 100
- 965 Shorepoint Ct
- 1220 9th St
- 933 Shoreline Dr Unit 203
- 1301 9th St
- 1001 Shoreline Dr Unit 301
- 404 Coral Reef Rd
- 1203 Benton St
- 1059 Santa Clara Ave
- 1512 Mozart St
- 1305 Webster St Unit C309
- 1305 Webster St Unit C102
- 1523 Verdi St
- 608 Fortress Isle
- 1333 Webster St Unit A107
- 1321 Webster St Unit D119
- 1321 Webster St Unit D116
- 624 Tarryton Isle
- 612 Tarryton Isle
- 630 Tarryton Isle
- 600 Tarryton Isle
- 621 Tarryton Isle
- 615 Tarryton Isle
- 627 Tarryton Isle
- 636 Tarryton Isle
- 1009 Otis Dr Unit 2
- 609 Tarryton Isle
- 633 Tarryton Isle
- 1015 Otis Dr
- 621 Sand Hook Isle
- 615 Sand Hook Isle
- 627 Sand Hook Isle
- 644 Tarryton Isle
- 639 Tarryton Isle
- 933 Otis Dr
- 633 Sand Hook Isle
- 1021 Otis Dr