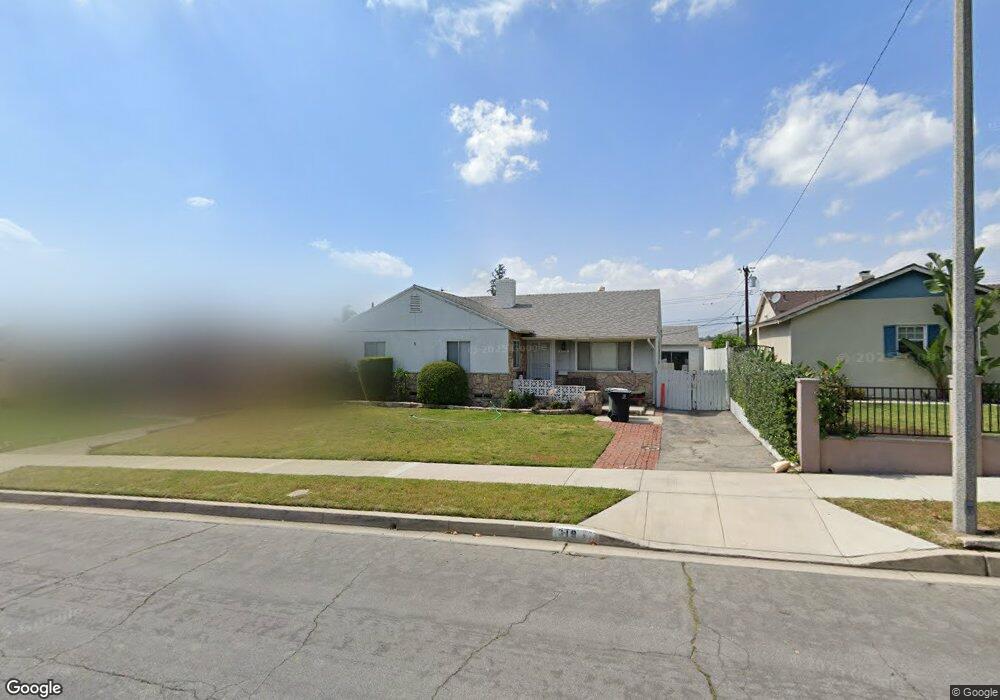
619 Andover Dr Burbank, CA 91504
Hillside District NeighborhoodEstimated Value: $1,310,033 - $1,684,000
3
Beds
2
Baths
1,515
Sq Ft
$994/Sq Ft
Est. Value
About This Home
This home is located at 619 Andover Dr, Burbank, CA 91504 and is currently estimated at $1,506,508, approximately $994 per square foot. 619 Andover Dr is a home located in Los Angeles County with nearby schools including Thomas Jefferson Elementary School, John Muir Middle School, and Burbank High School.
Ownership History
Date
Name
Owned For
Owner Type
Purchase Details
Closed on
Feb 2, 2012
Sold by
Solyom Karen M
Bought by
Solyom Karen M
Current Estimated Value
Home Financials for this Owner
Home Financials are based on the most recent Mortgage that was taken out on this home.
Original Mortgage
$325,500
Outstanding Balance
$222,466
Interest Rate
3.84%
Mortgage Type
New Conventional
Estimated Equity
$1,284,042
Purchase Details
Closed on
Apr 11, 2000
Sold by
Solyom David B
Bought by
Solyom Karen M
Purchase Details
Closed on
Apr 15, 1996
Sold by
Limbaga Terry
Bought by
Limbaga Terry Silbing and Limbaga Alexandria Marie
Home Financials for this Owner
Home Financials are based on the most recent Mortgage that was taken out on this home.
Original Mortgage
$194,000
Interest Rate
7.8%
Purchase Details
Closed on
Mar 20, 1996
Sold by
Limbaga Terry S
Bought by
Solyom David B and Solyom Karen M
Home Financials for this Owner
Home Financials are based on the most recent Mortgage that was taken out on this home.
Original Mortgage
$194,000
Interest Rate
7.8%
Create a Home Valuation Report for This Property
The Home Valuation Report is an in-depth analysis detailing your home's value as well as a comparison with similar homes in the area
Home Values in the Area
Average Home Value in this Area
Purchase History
| Date | Buyer | Sale Price | Title Company |
|---|---|---|---|
| Solyom Karen M | -- | Lsi | |
| Solyom Karen M | -- | -- | |
| Limbaga Terry Silbing | -- | Gateway Title Company | |
| Solyom David B | $242,500 | Gateway Title Company |
Source: Public Records
Mortgage History
| Date | Status | Borrower | Loan Amount |
|---|---|---|---|
| Open | Solyom Karen M | $325,500 | |
| Previous Owner | Solyom David B | $194,000 |
Source: Public Records
Tax History Compared to Growth
Tax History
| Year | Tax Paid | Tax Assessment Tax Assessment Total Assessment is a certain percentage of the fair market value that is determined by local assessors to be the total taxable value of land and additions on the property. | Land | Improvement |
|---|---|---|---|---|
| 2025 | $4,631 | $402,832 | $243,695 | $159,137 |
| 2024 | $4,631 | $394,934 | $238,917 | $156,017 |
| 2023 | $4,584 | $387,191 | $234,233 | $152,958 |
| 2022 | $4,381 | $379,600 | $229,641 | $149,959 |
| 2021 | $4,359 | $372,158 | $225,139 | $147,019 |
| 2019 | $4,188 | $361,121 | $218,462 | $142,659 |
| 2018 | $4,050 | $354,041 | $214,179 | $139,862 |
| 2016 | $3,838 | $340,295 | $205,863 | $134,432 |
| 2015 | $3,761 | $335,184 | $202,771 | $132,413 |
| 2014 | $3,757 | $328,619 | $198,799 | $129,820 |
Source: Public Records
Map
Nearby Homes
- 648 Uclan Dr
- 441 University Ave
- 812 Uclan Dr
- 1814 Grismer Ave
- 1923 Grismer Ave
- 1608 Grismer Ave
- 418 Delaware Rd
- 906 Groton Dr
- 736 Irving Dr
- 1809 Peyton Ave Unit 313
- 230 Bethany Rd Unit 117
- 710 E Walnut Ave
- 1622 Keeler St
- 1702 Landis St
- 724 Price Dr
- 854 Irving Dr
- 2615 Woodstock Ln
- 2000 Peyton Ave
- 2014 Peyton Ave
- 227 E Burbank Blvd Unit E
- 625 Andover Dr
- 618 Birmingham Rd
- 612 Birmingham Rd
- 631 Andover Dr
- 607 Andover Dr
- 624 Birmingham Rd
- 606 Birmingham Rd
- 614 Andover Dr
- 620 Andover Dr
- 630 Birmingham Rd
- 601 Andover Dr
- 637 Andover Dr
- 600 Birmingham Rd
- 628 Andover Dr
- 636 Birmingham Rd
- 600 Andover Dr
- 636 Andover Dr
- 643 Andover Dr
- 611 Uclan Dr
- 619 Uclan Dr