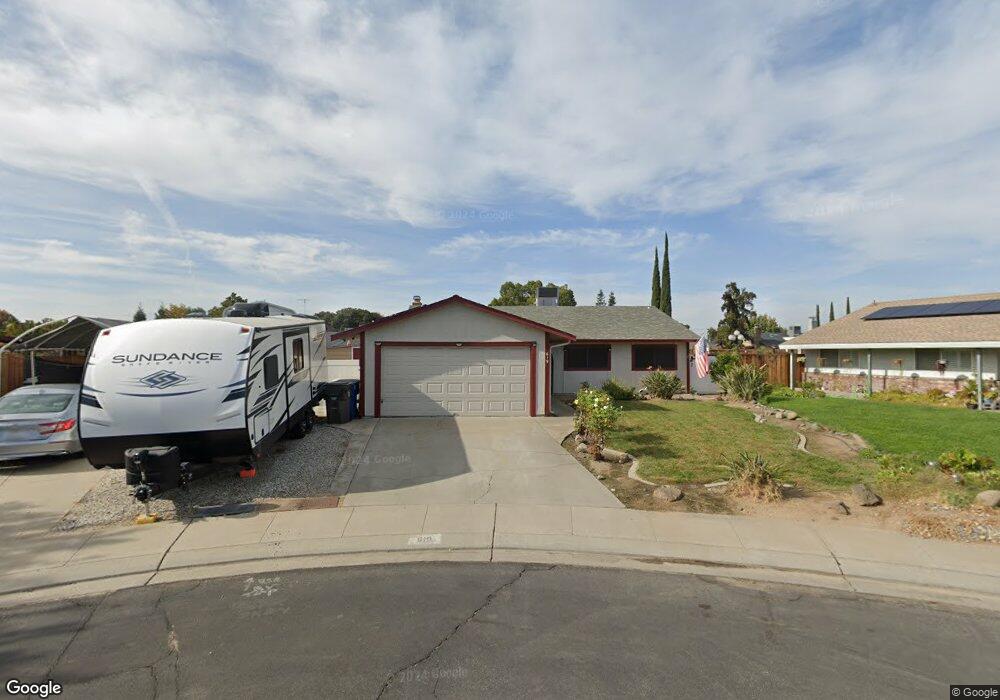
619 Elm Ct Manteca, CA 95336
Downtown Manteca NeighborhoodEstimated Value: $440,000 - $483,000
3
Beds
2
Baths
1,428
Sq Ft
$329/Sq Ft
Est. Value
About This Home
This home is located at 619 Elm Ct, Manteca, CA 95336 and is currently estimated at $469,609, approximately $328 per square foot. 619 Elm Ct is a home located in San Joaquin County with nearby schools including Golden West Elementary School, Manteca High School, and St. Anthony's Catholic School.
Ownership History
Date
Name
Owned For
Owner Type
Purchase Details
Closed on
May 23, 2024
Sold by
Contreras Manuel Verdugo
Bought by
Verdugo Contreras Manuel and Verdugo Richard Contreras
Current Estimated Value
Purchase Details
Closed on
Jun 28, 2013
Sold by
Contreras Manuel and Contreras Josette
Bought by
Contreras Manuel and Contreras Josette
Home Financials for this Owner
Home Financials are based on the most recent Mortgage that was taken out on this home.
Original Mortgage
$137,500
Interest Rate
3.79%
Mortgage Type
New Conventional
Purchase Details
Closed on
Mar 28, 2000
Sold by
Cole Paul and M R
Bought by
Urbanski Josette and Contreras Manuel
Home Financials for this Owner
Home Financials are based on the most recent Mortgage that was taken out on this home.
Original Mortgage
$155,716
Interest Rate
8.38%
Mortgage Type
FHA
Create a Home Valuation Report for This Property
The Home Valuation Report is an in-depth analysis detailing your home's value as well as a comparison with similar homes in the area
Home Values in the Area
Average Home Value in this Area
Purchase History
| Date | Buyer | Sale Price | Title Company |
|---|---|---|---|
| Verdugo Contreras Manuel | -- | None Listed On Document | |
| Contreras Manuel | -- | Lsi Title | |
| Urbanski Josette | $157,000 | Old Republic Title Company |
Source: Public Records
Mortgage History
| Date | Status | Borrower | Loan Amount |
|---|---|---|---|
| Previous Owner | Contreras Manuel | $137,500 | |
| Previous Owner | Urbanski Josette | $155,716 |
Source: Public Records
Tax History
| Year | Tax Paid | Tax Assessment Tax Assessment Total Assessment is a certain percentage of the fair market value that is determined by local assessors to be the total taxable value of land and additions on the property. | Land | Improvement |
|---|---|---|---|---|
| 2025 | $2,928 | $262,097 | $69,157 | $192,940 |
| 2024 | $2,846 | $256,958 | $67,801 | $189,157 |
| 2023 | $2,590 | $231,921 | $66,472 | $165,449 |
| 2022 | $2,551 | $227,374 | $65,169 | $162,205 |
| 2021 | $2,524 | $222,917 | $63,892 | $159,025 |
| 2020 | $2,422 | $220,632 | $63,237 | $157,395 |
| 2019 | $2,390 | $216,307 | $61,998 | $154,309 |
| 2018 | $2,359 | $212,067 | $60,783 | $151,284 |
| 2017 | $2,325 | $207,910 | $59,592 | $148,318 |
| 2016 | $2,269 | $203,835 | $58,424 | $145,411 |
| 2014 | $2,109 | $196,840 | $56,419 | $140,421 |
Source: Public Records
Map
Nearby Homes
- 290 Victory Ave
- 449 Poplar Ave
- 811 Hacienda Ave
- 445 N Walnut Ave
- 840 Del Monte Ct
- 322 Poplar Ave
- 1073 Hacienda Ave
- 846 Del Monte Ct
- 414 Cherry Ln Unit G
- 885 Del Monte Ct
- 324 Eva Ct
- 1155 Lorene Ave
- 1023 Camphor St
- 819 Brandywine St
- 1131 Meadowbrook Ct
- 480 Cherry Ln Unit E
- 802 W Center St
- 1217 Princeton Place
- 495 Cherry Ln Unit B
- 495 Cherry Ln Unit J
Your Personal Tour Guide
Ask me questions while you tour the home.