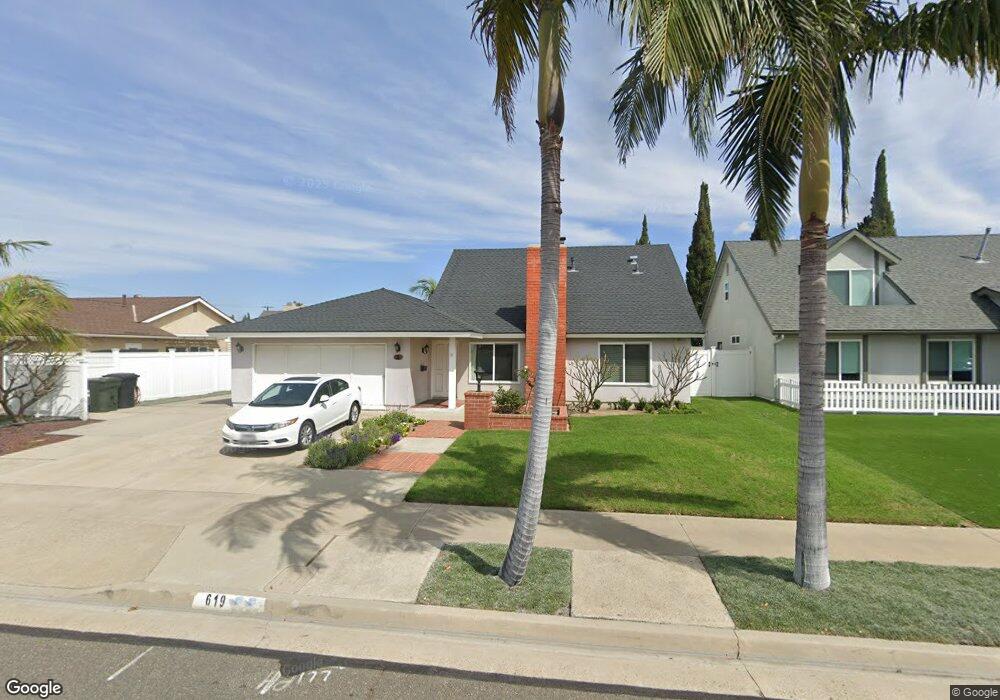
619 Highlander Ave Placentia, CA 92870
Estimated Value: $1,002,000 - $1,213,000
4
Beds
2
Baths
1,513
Sq Ft
$737/Sq Ft
Est. Value
About This Home
This home is located at 619 Highlander Ave, Placentia, CA 92870 and is currently estimated at $1,114,792, approximately $736 per square foot. 619 Highlander Ave is a home located in Orange County with nearby schools including Wagner Elementary School, Col. J. K. Tuffree Middle School, and El Dorado High School.
Ownership History
Date
Name
Owned For
Owner Type
Purchase Details
Closed on
Aug 13, 2025
Sold by
Arroyo Nelson and Arroyo Laurie A
Bought by
Nelson And Laurie A Arroyo Family Revocable T and Arroyo
Current Estimated Value
Purchase Details
Closed on
Sep 16, 2002
Sold by
Nyaggah Mougo and Nyaggah Lynette
Bought by
Arroyo Nelson and Arroyo Laurie A
Home Financials for this Owner
Home Financials are based on the most recent Mortgage that was taken out on this home.
Original Mortgage
$300,000
Interest Rate
6.09%
Purchase Details
Closed on
Mar 3, 1999
Sold by
Shiwlall Jack R and Shiwlall Marjorie E
Bought by
Nyaggah Mougo and Nyaggah Lynette
Home Financials for this Owner
Home Financials are based on the most recent Mortgage that was taken out on this home.
Original Mortgage
$179,100
Interest Rate
6.73%
Create a Home Valuation Report for This Property
The Home Valuation Report is an in-depth analysis detailing your home's value as well as a comparison with similar homes in the area
Home Values in the Area
Average Home Value in this Area
Purchase History
| Date | Buyer | Sale Price | Title Company |
|---|---|---|---|
| Nelson And Laurie A Arroyo Family Revocable T | -- | None Listed On Document | |
| Arroyo Nelson | $375,000 | Chicago Title Co | |
| Nyaggah Mougo | $224,000 | Orange Coast Title |
Source: Public Records
Mortgage History
| Date | Status | Borrower | Loan Amount |
|---|---|---|---|
| Previous Owner | Arroyo Nelson | $300,000 | |
| Previous Owner | Nyaggah Mougo | $179,100 |
Source: Public Records
Tax History
| Year | Tax Paid | Tax Assessment Tax Assessment Total Assessment is a certain percentage of the fair market value that is determined by local assessors to be the total taxable value of land and additions on the property. | Land | Improvement |
|---|---|---|---|---|
| 2025 | $6,595 | $543,115 | $420,252 | $122,863 |
| 2024 | $6,595 | $532,466 | $412,012 | $120,454 |
| 2023 | $6,443 | $522,026 | $403,933 | $118,093 |
| 2022 | $6,333 | $511,791 | $396,013 | $115,778 |
| 2021 | $6,169 | $501,756 | $388,248 | $113,508 |
| 2020 | $6,073 | $496,612 | $384,267 | $112,345 |
| 2019 | $5,829 | $486,875 | $376,732 | $110,143 |
| 2018 | $5,752 | $477,329 | $369,345 | $107,984 |
| 2017 | $5,653 | $467,970 | $362,103 | $105,867 |
| 2016 | $5,539 | $458,795 | $355,003 | $103,792 |
| 2015 | $5,467 | $451,904 | $349,671 | $102,233 |
| 2014 | $5,311 | $443,052 | $342,821 | $100,231 |
Source: Public Records
Map
Nearby Homes
- 1418 Avenida de Vaca
- 1410 Via Cortez
- 5142 Hamer Ln
- 630 Shady Ln
- 324 Rio Grande Ave
- 1254 Venice Ave
- 230 Gila Way
- 500 Brower Ave
- 1126 Naples Ave
- 1202 N Ventana Ln
- 1837 Kelleher Place
- 1000 Henrietta Cir
- 1232 Woodside Dr
- 211 Doverfield Dr Unit 57
- 1125 Dover Way
- 937 Finnell Way
- 921 Azalea Ave
- 724 Longfellow Dr
- 109 Laurelwood Ave
- 1963 Wilcox Unit 4-6
- 613 Highlander Ave
- 625 Highlander Ave
- 620 Heather Ave
- 626 Heather Ave
- 614 Heather Ave
- 607 Highlander Ave
- 631 Highlander Ave
- 620 Highlander Ave
- 632 Heather Ave
- 614 Highlander Ave
- 626 Highlander Ave
- 608 Heather Ave
- 637 Highlander Ave
- 601 Highlander Ave
- 608 Highlander Ave
- 632 Highlander Ave
- 638 Heather Ave
- 602 Heather Ave Unit A
- 602 Heather Ave
- 638 Highlander Ave
Your Personal Tour Guide
Ask me questions while you tour the home.